
 Bildad Oyugi ··12 min read

Your weekly report says CSAT fell from 90% to 85%. Your manager asks three things: is 85% bad, where does the number come from, and what should the team change before next week?
You know the CSAT survey goes out after tickets close. You're less sure the question asks the right thing, or that you can base a decision on 40 ratings.
On 40 ratings, the drop from 90% to 85% means 34 satisfied ratings instead of 36. At 85%, that sample carries a margin of error of about 11 points.
What Does CSAT (Customer Satisfaction Score) Mean?
CSAT stands for customer satisfaction score. It measures how a customer felt about one specific interaction, such as a support conversation, a delivery or an onboarding call.
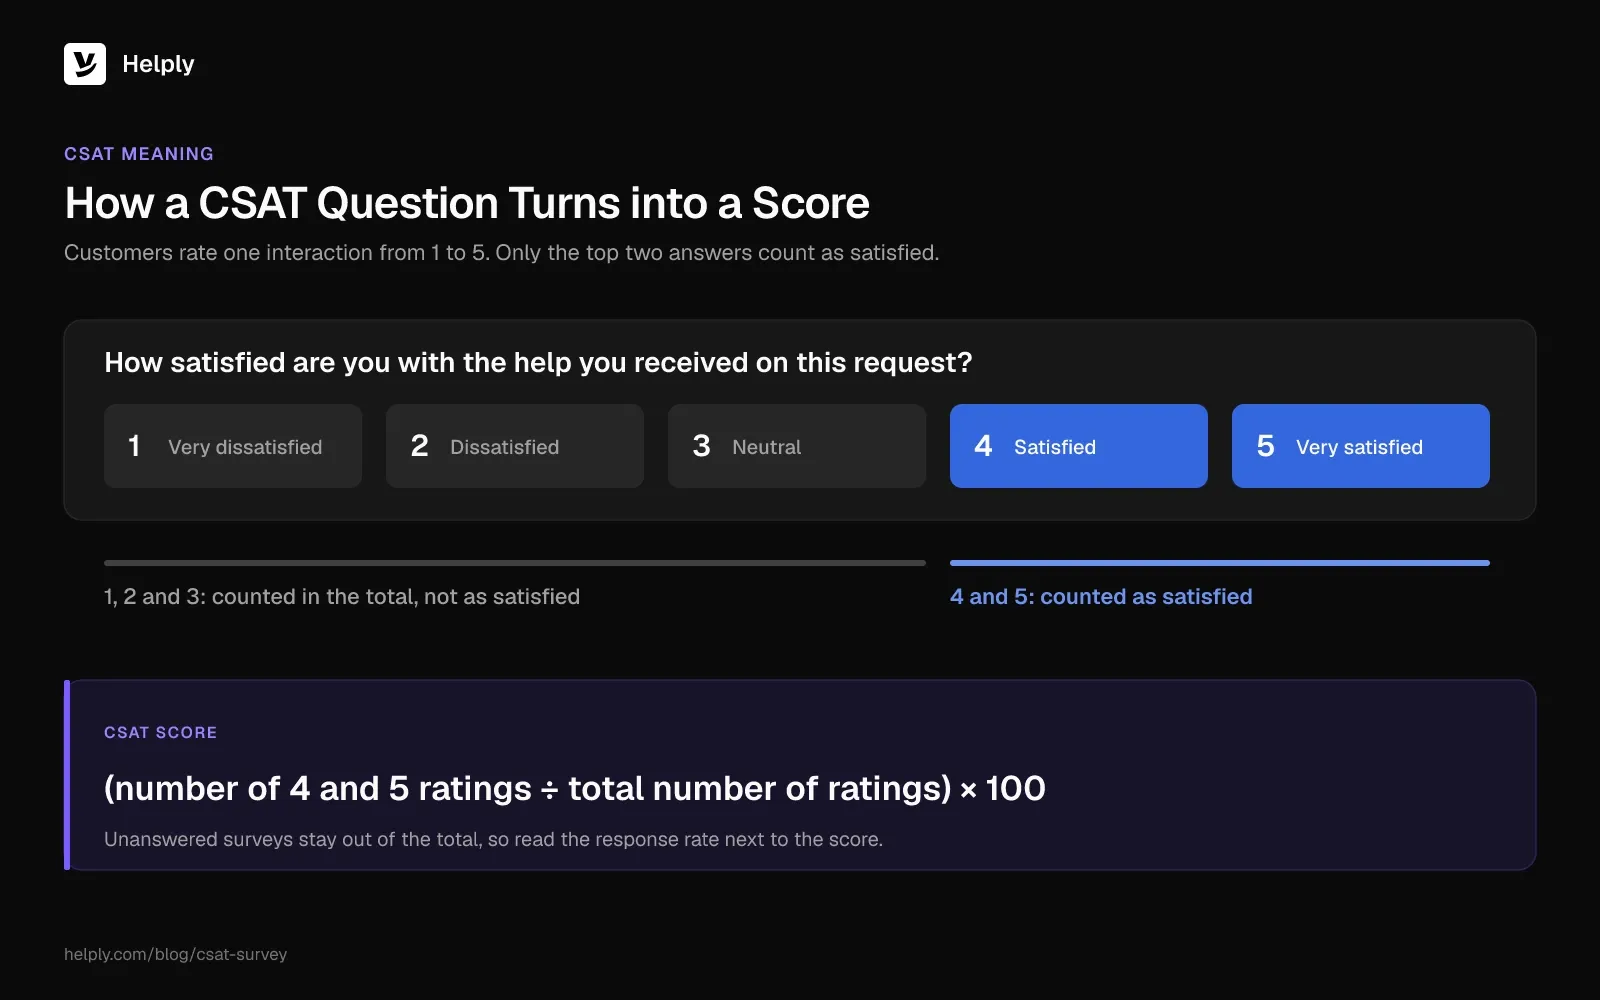
A CSAT survey is transactional. It asks about a moment that ended minutes or hours ago, and it usually uses five labeled points:
- 1: Very dissatisfied
- 2: Dissatisfied
- 3: Neutral
- 4: Satisfied
- 5: Very satisfied
Your CSAT score counts the 4s and 5s as satisfied and reports them as a percentage of all ratings. Freshworks' 2024 Customer Service Benchmark Report calls this positive CSAT %: "the percentage of customers who respond positively to a CSAT survey."
CSAT vs. the American Customer Satisfaction Index
You'll see the American Customer Satisfaction Index (ACSI) quoted as a CSAT benchmark. In its Q1 2026 release, ACSI reported a national score of 76.7 out of 100, the same score as in 2013.
That figure is a weighted index built from more than 200,000 interviews a year with US consumers about the companies they buy from. ACSI weights each sector by its share of US GDP.
ACSI scores overall satisfaction with a company on a 0 to 100 scale. A ticket CSAT counts the share of support ratings at 4 or 5. A 76.7 on ACSI and a 76.7% CSAT mean different things.
How to Calculate Your CSAT Score
To calculate CSAT, divide the number of 4 and 5 ratings by all ratings, then multiply by 100. Help desks and survey tools can also report an average out of 5. Your team can look steady on one measure and slipping on the other.
The CSAT Formula
CSAT score (%) = (number of 4 and 5 ratings ÷ total number of ratings) × 100
Count only customers who answered. Unanswered surveys stay out of the denominator, so read the response rate next to the score.
If your scale is a thumbs up or down, the formula becomes thumbs up ÷ all ratings × 100. On a 1 to 7 scale, decide in advance which points count as satisfied, usually 6 and 7. Then keep that rule fixed.
Worked Example: 200 Ratings
Say your team collected 200 ratings in a month:
| Rating | Responses | Points |
|---|---|---|
| 5: Very satisfied | 120 | 600 |
| 4: Satisfied | 52 | 208 |
| 3: Neutral | 12 | 36 |
| 2: Dissatisfied | 8 | 16 |
| 1: Very dissatisfied | 8 | 8 |
| Total | 200 | 868 |
The CSAT score is (120 + 52) ÷ 200 × 100 = 86%. The average rating is 868 ÷ 200 = 4.34 out of 5.
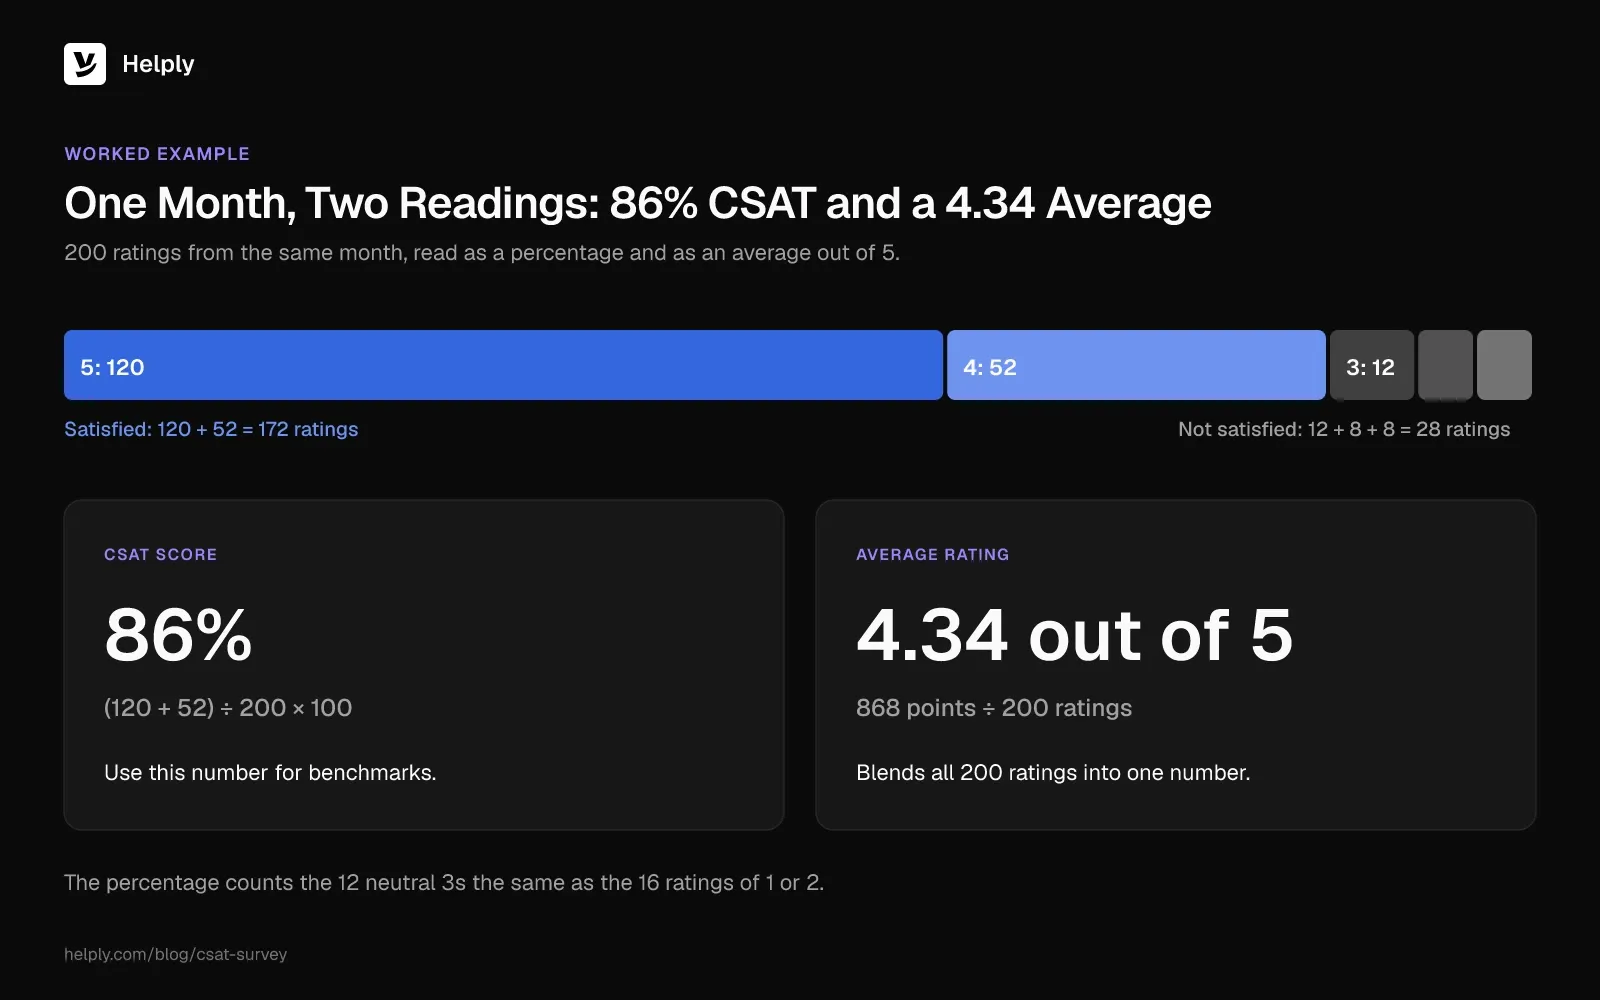
Both numbers describe the same month. The percentage counts the 12 neutral 3s the same as the 16 ratings of 1 or 2. The average blends all 200 ratings into one number.
Report the percentage for benchmarks and track the count of 1s and 2s as its own number.
CSAT Calculator: Ratings Needed per Score and Margin of Error
Find your total number of ratings in the first column. The next five columns show the fewest 4 and 5 ratings that reach each score, rounded up. The last column shows the margin of error.
| Total ratings | 75% | 80% | 85% | 90% | 95% | Margin of error near 80% |
|---|---|---|---|---|---|---|
| 25 | 19 | 20 | 22 | 23 | 24 | ±15.7 points |
| 40 | 30 | 32 | 34 | 36 | 38 | ±12.4 points |
| 50 | 38 | 40 | 43 | 45 | 48 | ±11.1 points |
| 100 | 75 | 80 | 85 | 90 | 95 | ±7.8 points |
| 200 | 150 | 160 | 170 | 180 | 190 | ±5.5 points |
| 400 | 300 | 320 | 340 | 360 | 380 | ±3.9 points |
| 1,000 | 750 | 800 | 850 | 900 | 950 | ±2.5 points |
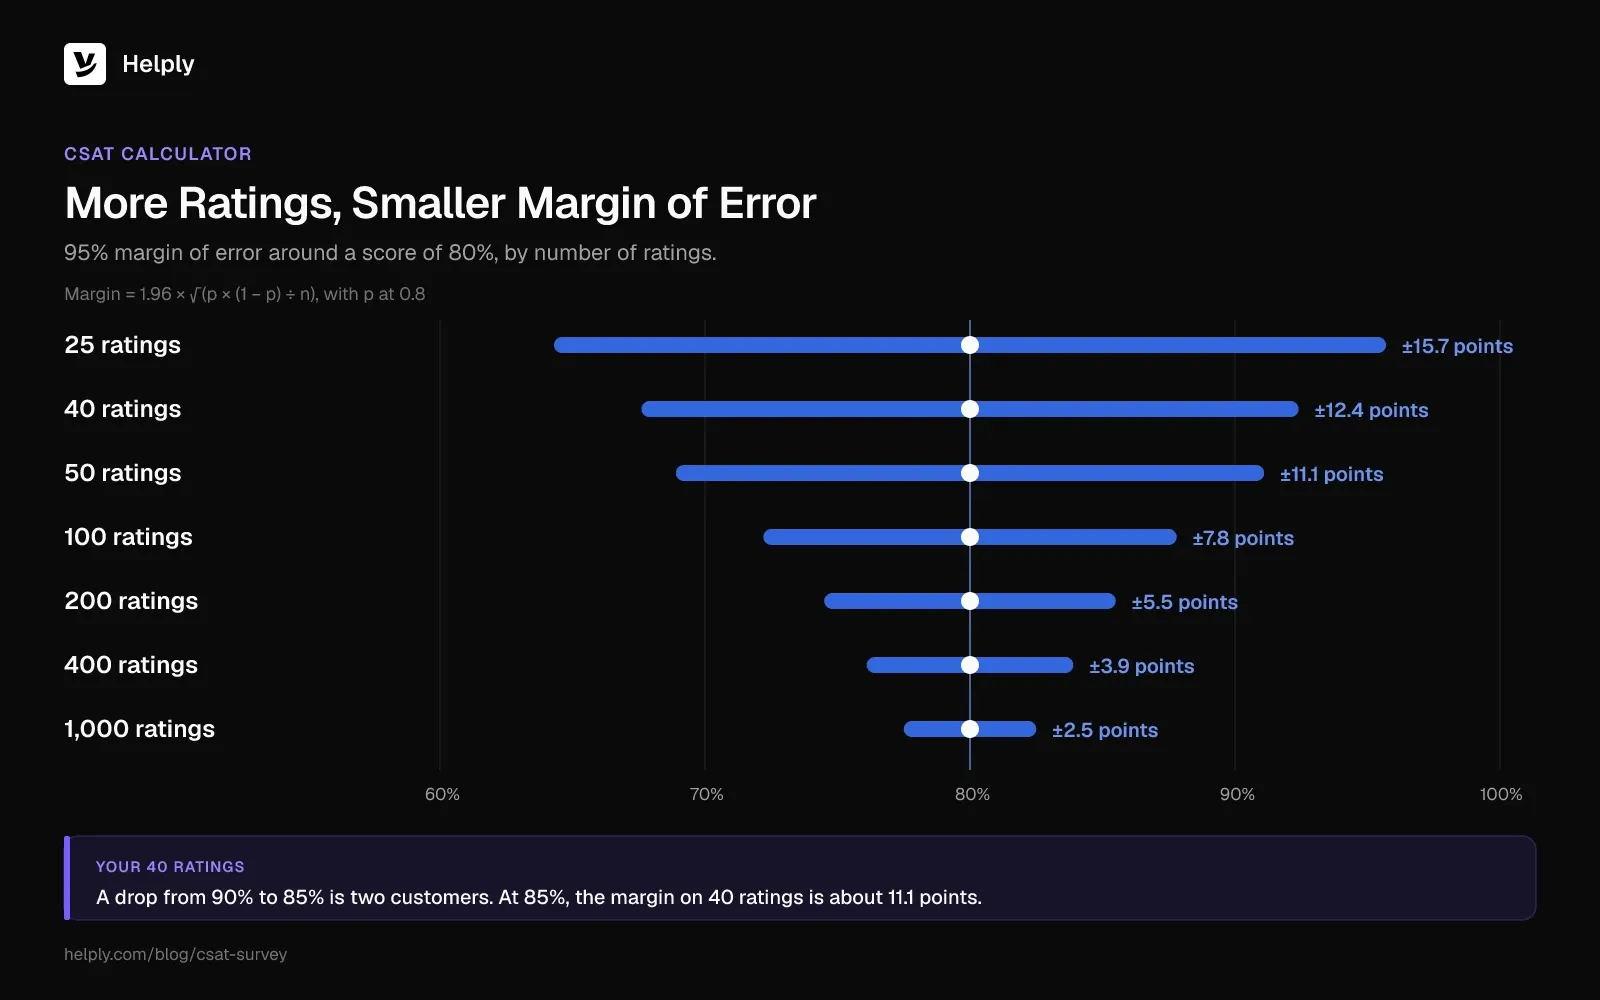
For any other total, divide your satisfied ratings by the total and multiply by 100. The margin of error column uses the 95% confidence formula for a proportion. That formula is 1.96 × √(p × (1 − p) ÷ n), with p at 0.8.
At a score of 85%, the margin on 40 ratings narrows to about 11.1 points.
How Many Responses Do You Need?
At 200 ratings, the margin near 80% is 5.5 points. It drops to 3.9 points at 400 ratings and 2.5 at 1,000.
A drop from 90% to 85% on 40 ratings sits inside the margin of error. On 400 ratings a week, the same drop is larger than the 3.9-point margin on each week's score. Check that it holds the following week before you change anything.
Your response rate sets your sample size. Survicate's 2025 benchmark found a median CSAT survey response rate of 7.5% across 560 surveys. Delighted, now part of Qualtrics, reported 6% for email surveys in its 2021 data.
At those rates, 1,000 solved tickets a month yield about 60 to 75 ratings.
On low volume, read your CSAT monthly or quarterly instead of weekly. Pair the score with the raw count of 1s and 2s, which you can read one by one.
15 CSAT Survey Questions for Support Teams
A support CSAT survey needs two of these questions: the rating question (1) and the reason question (12). Add one or two of the others when you have a decision that needs the answer.
| Question | Scale | Use it when |
|---|---|---|
| How satisfied are you with the help you received on this request? | 1 to 5, very dissatisfied to very satisfied | Always. This is the CSAT question. |
| Did we fully solve your issue? | Yes / Partly / No | You suspect tickets close before the problem is fixed. |
| Did you have to contact us more than once about this? | Yes / No | Repeat contacts are rising. |
| How easy was it to get this resolved? | 1 to 7, very difficult to very easy | You want an effort signal next to satisfaction. |
| How satisfied are you with the speed of our replies? | 1 to 5 | Response times changed, such as after a staffing shift. |
| How clearly did we explain the next steps? | 1 to 5, not at all clear to very clear | Customers come back with "what now?" questions. |
| Did our team understand your question the first time you asked? | Yes / No | Tickets bounce between agents. |
| How would you rate our team's knowledge of the product? | 1 to 5, very poor to excellent | You're training new agents or launching a product. |
| Did the answer from our AI assistant solve your question? | Yes / No | An AI agent answers part of your queue. |
| When we passed you to a person, did you have to repeat yourself? | Yes / No | AI or tier-one handoffs feel clumsy. |
| Did you look for an answer in our help center before contacting us? | Yes, it didn't help / Yes, I couldn't find it / No | You're deciding which articles to write. |
| What's the main reason for your score? | Pick one: speed of reply, quality of the answer, had to explain more than once, the product itself, other | Always, as the one follow-up after question 1. |
| What could we have done to make this a 5? | Open text, shown after a 1, 2 or 3 | You want the fix behind a low score. |
| What did we do well? | Open text, shown after a 4 or 5 | You want examples for coaching and training. |
| May we contact you about your answer? | Yes / No | You plan to follow up on low scores. |
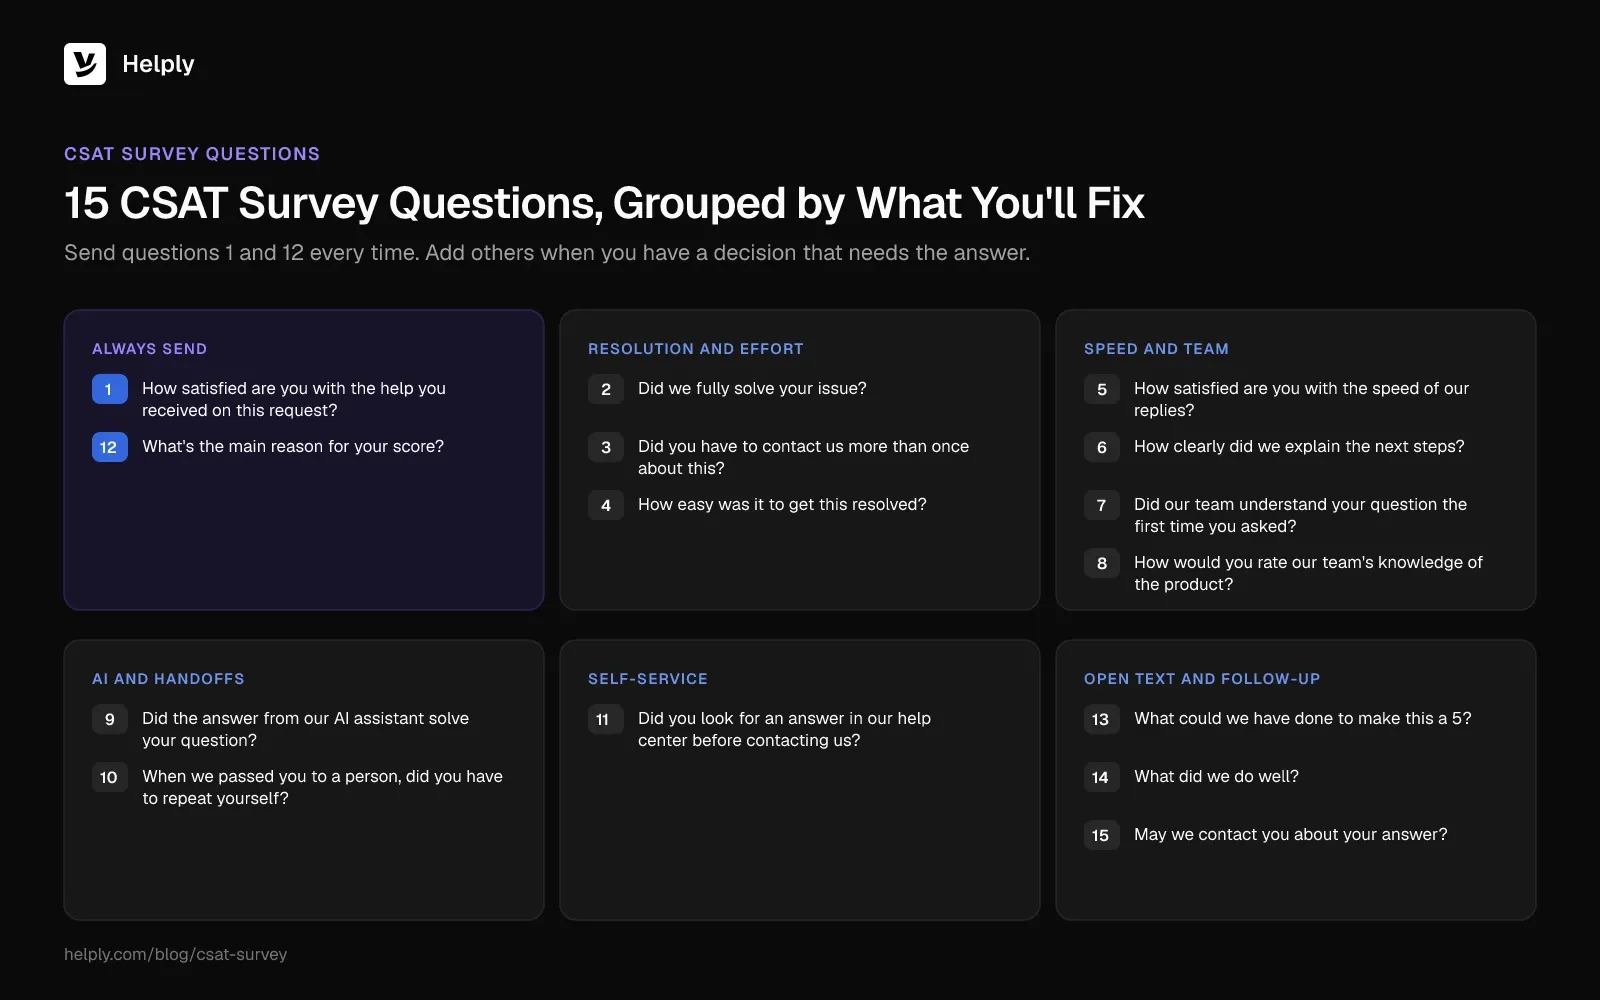
Questions 9 and 10 split AI and human experiences. A customer who rates a 2 after an AI answer needs a different fix than one who waited two days for a person.
Question 12's fixed reasons let you count causes across hundreds of ratings. The open text in questions 13 and 14 gives you the quotes.
CSAT Survey Template for a Solved Ticket
Copy this into your help desk or survey tool and adjust the wording to your voice:
Subject line: How did we do with your request?
Opening: Hi {first name}, we've marked your request "{ticket subject}" as solved. Not fixed yet? Reply to this email and we'll reopen it.
Rating question: How satisfied are you with the help you received on this request?
- 1: Very dissatisfied
- 2: Dissatisfied
- 3: Neutral
- 4: Satisfied
- 5: Very satisfied
Follow-up questions:
- After any rating: What's the main reason for your score? Options: speed of reply, quality of the answer, had to explain more than once, the product itself, other.
- After a 1, 2 or 3 (optional comment box): What could we have done to make this a 5?
- After a 4 or 5 (optional comment box): What did we do well?
- After a 1 or 2 (optional): May we contact you about your answer? Yes / No
Put the rating inside the email or chat itself so one click records the score. Each extra page between the customer and the rating can cost responses.
When Should You Send a CSAT Survey?
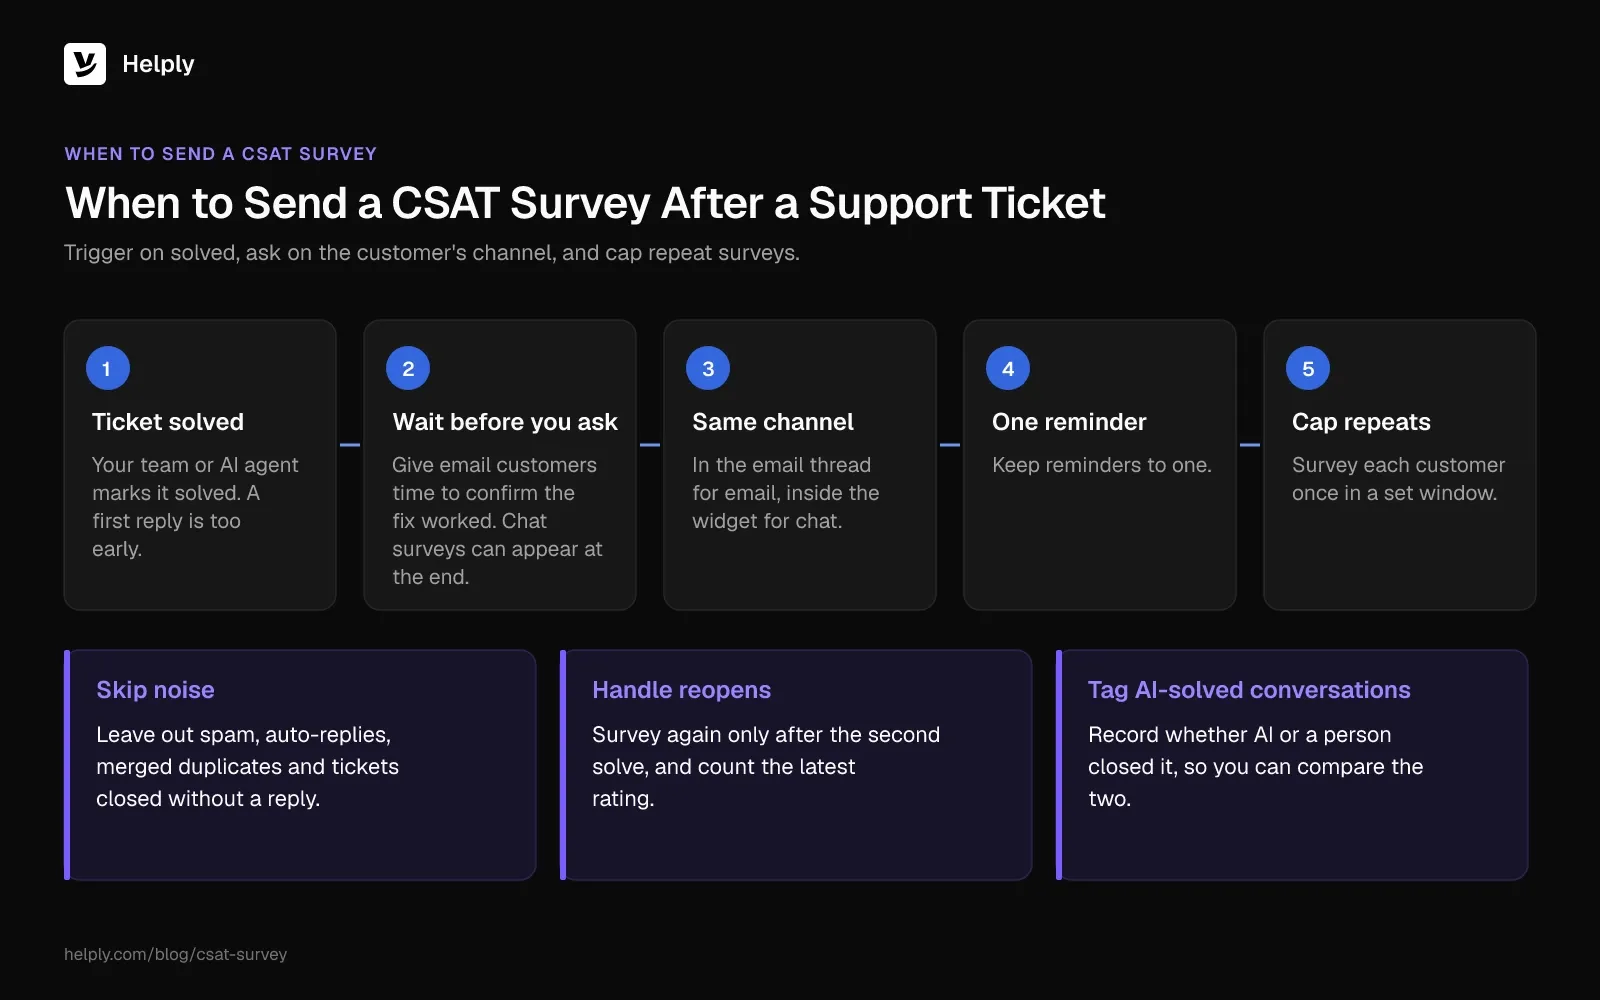
Send a CSAT survey after the interaction ends and while it is still fresh. For support, follow seven rules:
- Trigger on solved. Send the survey when your team or AI agent marks the ticket solved. A first reply is too early.
- Wait before you ask. Give email customers time to confirm the fix worked before the survey arrives. Chat surveys can appear at the end of the chat.
- Match the channel. Ask in the email thread for email tickets and inside the widget for chat. Delighted's 2021 data showed 6% response for email, 8% for website and 16% for in-app surveys on iOS.
- Cap repeats. Survey each customer once in a set window, so busy customers don't tune out.
- Skip noise. Leave out spam, auto-replies, merged duplicates and tickets closed without a reply.
- Handle reopens. If a solved ticket reopens, send the survey again only after the second solve, and count the latest rating.
- Survey AI-solved conversations too. Tag each rating with whether AI or a person closed the conversation, so you can compare the two.
Keep reminders to one. Delighted notes that transactional surveys (CSAT or CES) "tend to have higher response rates than relational NPS surveys."
What Is a Good CSAT Score?
The benchmarks that report a median land at 80.0% and 85.2%. Survicate found 80.0% across all CSAT surveys in 2025, and Freshworks found 85.2% on support tickets from January 2023 to April 2024.
SurveyMonkey and Zendesk quote bands of 70% to 85% and 75% to 85% without citing data. Judge your score against your own baseline first, with enough ratings behind it.
CSAT Benchmarks Compared: Score, Channel, Sample and Date
| Source | Published score | What it measures | Sample | Period |
|---|---|---|---|---|
| Freshworks benchmark report | 85.2% median; 96.1% for the top 20% of accounts | Positive CSAT responses on tickets | 19M tickets, 17,000+ accounts | Jan 2023 to Apr 2024 |
| Simplesat benchmark report | 87.8% | CSAT responses collected through Simplesat | 3.5M responses | 2025 |
| Survicate benchmark report | 80.0% median; middle half 64.8% to 90.0% | CSAT surveys of all kinds, not support only | 1,259 surveys, 370 companies | 2025 |
| SQM Group | 77% "very satisfied" | Top-box rating after a call | 500+ North American call centers | 2023 |
| LiveChat customer service report | 64.2% | Rated live chats | about 1.7 billion chats | data last updated 2024 |
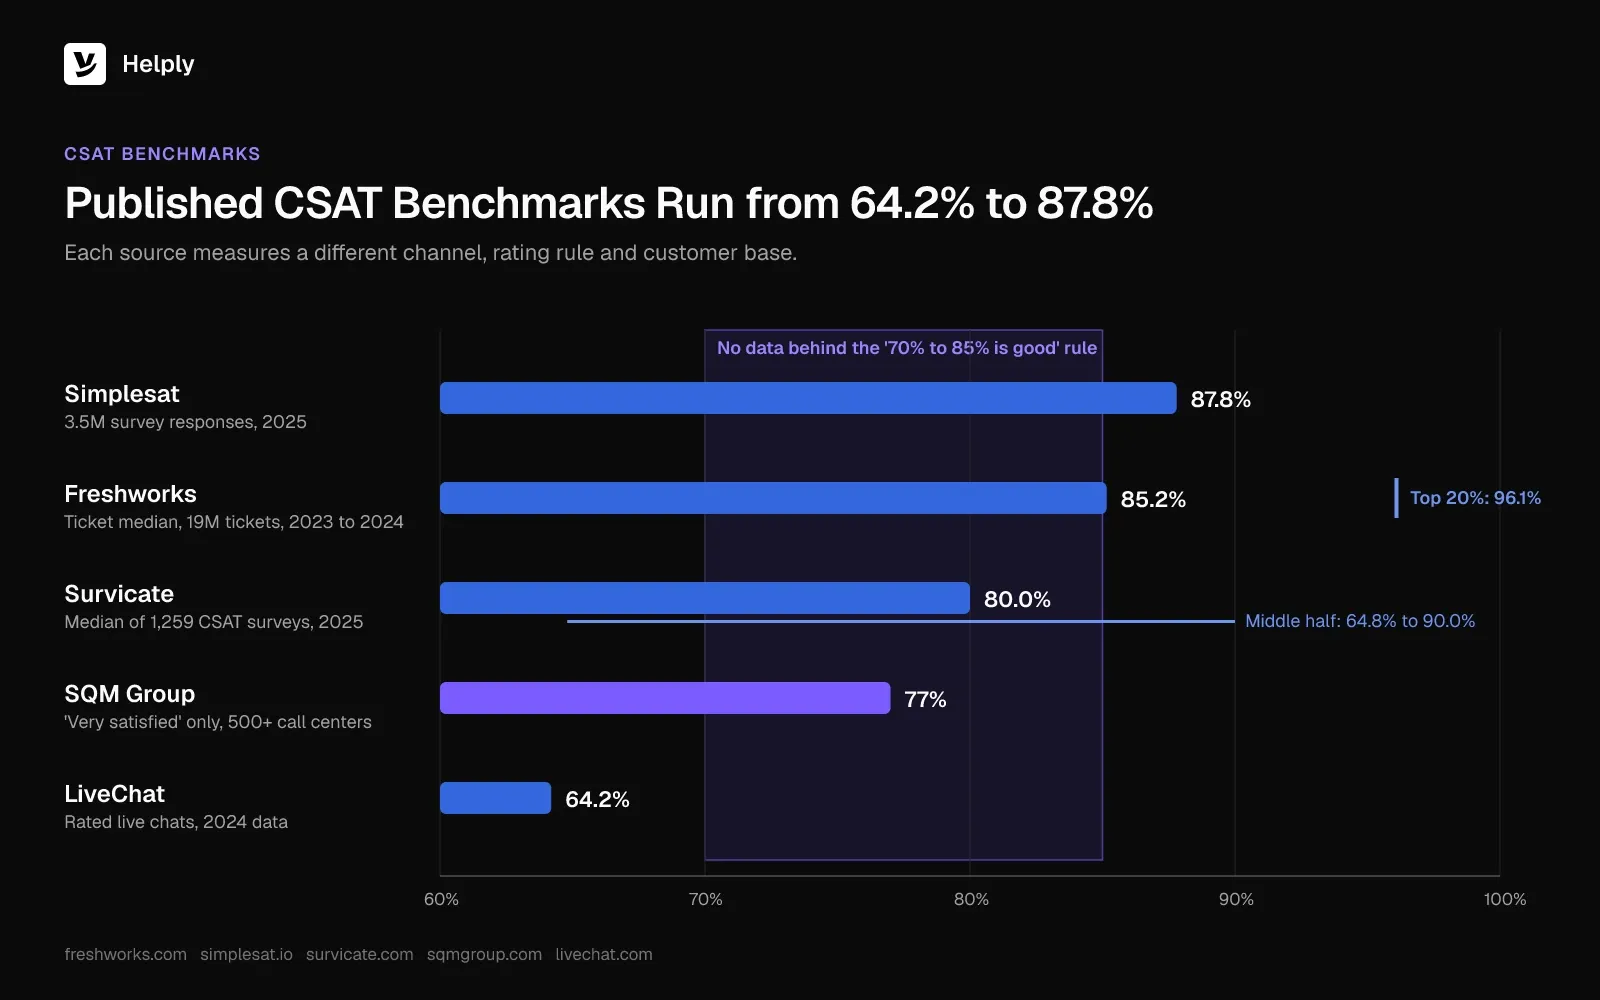
Each figure comes from the vendor's own customers, except SQM Group, which reports on 500+ North American call centers. Freshworks and Survicate report medians, Simplesat a benchmark from 3.5 million responses, and LiveChat an average across rated chats. SQM counts only the top box, a stricter rule than counting 4s and 5s.
LiveChat's chat average of 64.2% sits 21 points below the Freshworks ticket median of 85.2%. Pick the row that matches your channel and rating rule before you compare.
The 70% to 85% Rule of Thumb
You'll see 70% to 85% quoted as a good CSAT score. SurveyMonkey states that "A good CSAT score falls between 70% and 85%, though the right benchmark depends on your industry." Per Zendesk, many industries "consider a CSAT score between 75 and 85 percent as good and a score above 90 percent as exemplary."
SurveyMonkey's industry figures on the same page are ACSI index scores shown as percentages. Treat both bands as convention.
Use benchmarks for a sense check and your own trend for decisions. At 400 ratings a month, a 5-point move is larger than either month's 3.9-point margin. Check that it holds the next month before you act.
A team on 25 ratings has a margin of about 15.7 points, so it can't read anything into a 5-point move yet.
CSAT vs. NPS vs. CES: Which Survey Fits Which Moment?
CSAT asks about one interaction, CES asks how easy a fix was, and NPS asks about loyalty to the company overall. Support teams send CSAT and CES after a ticket, while NPS runs every few months.
| Survey | Question it asks | Scale | When to send | What it tells you |
|---|---|---|---|---|
| CSAT | How satisfied are you with this interaction? | 1 to 5 | Right after a solved conversation | How one experience landed |
| CES | How easy was it to get this resolved? | 1 to 7 | Right after a task or fix | Where customers hit friction |
| NPS | How likely are you to recommend us? | 0 to 10 | Every few months, not tied to a ticket | Loyalty to the company overall |
Support teams own CSAT and can add CES. NPS belongs to the whole company, so a support CSAT program should avoid asking "would you recommend us" after every ticket.
How to Act on a Low CSAT Score
To act on a low CSAT score, follow up fast, count the reasons, split the score and track your 1s. These four habits help you turn low ratings into changes:
- Follow up on every 1 and 2 within a working day. Contact customers who said yes to question 15 and read the other low-score tickets for a pattern.
- Count the reasons. Tally question 12 each month: "had to explain more than once" points at handoffs, and "the product itself" goes to the product team.
- Split the score. In your own reports, read CSAT by topic, channel, agent and AI versus human closes to catch one queue dropping.
- Track the count of 1s next to the percentage. Ten more 1s in a month matter even if higher volume holds the percentage steady.
Track CSAT before and after a new macro, a new article or a staffing change. Compare periods with similar volume and channel mix.
Tracking and Acting on CSAT in Helply
Helply includes CSAT surveys and shows the scores in its support analytics, next to conversations, resolutions, response times, escalations and AI performance. You can see what AI handled on its own and what reached your team.
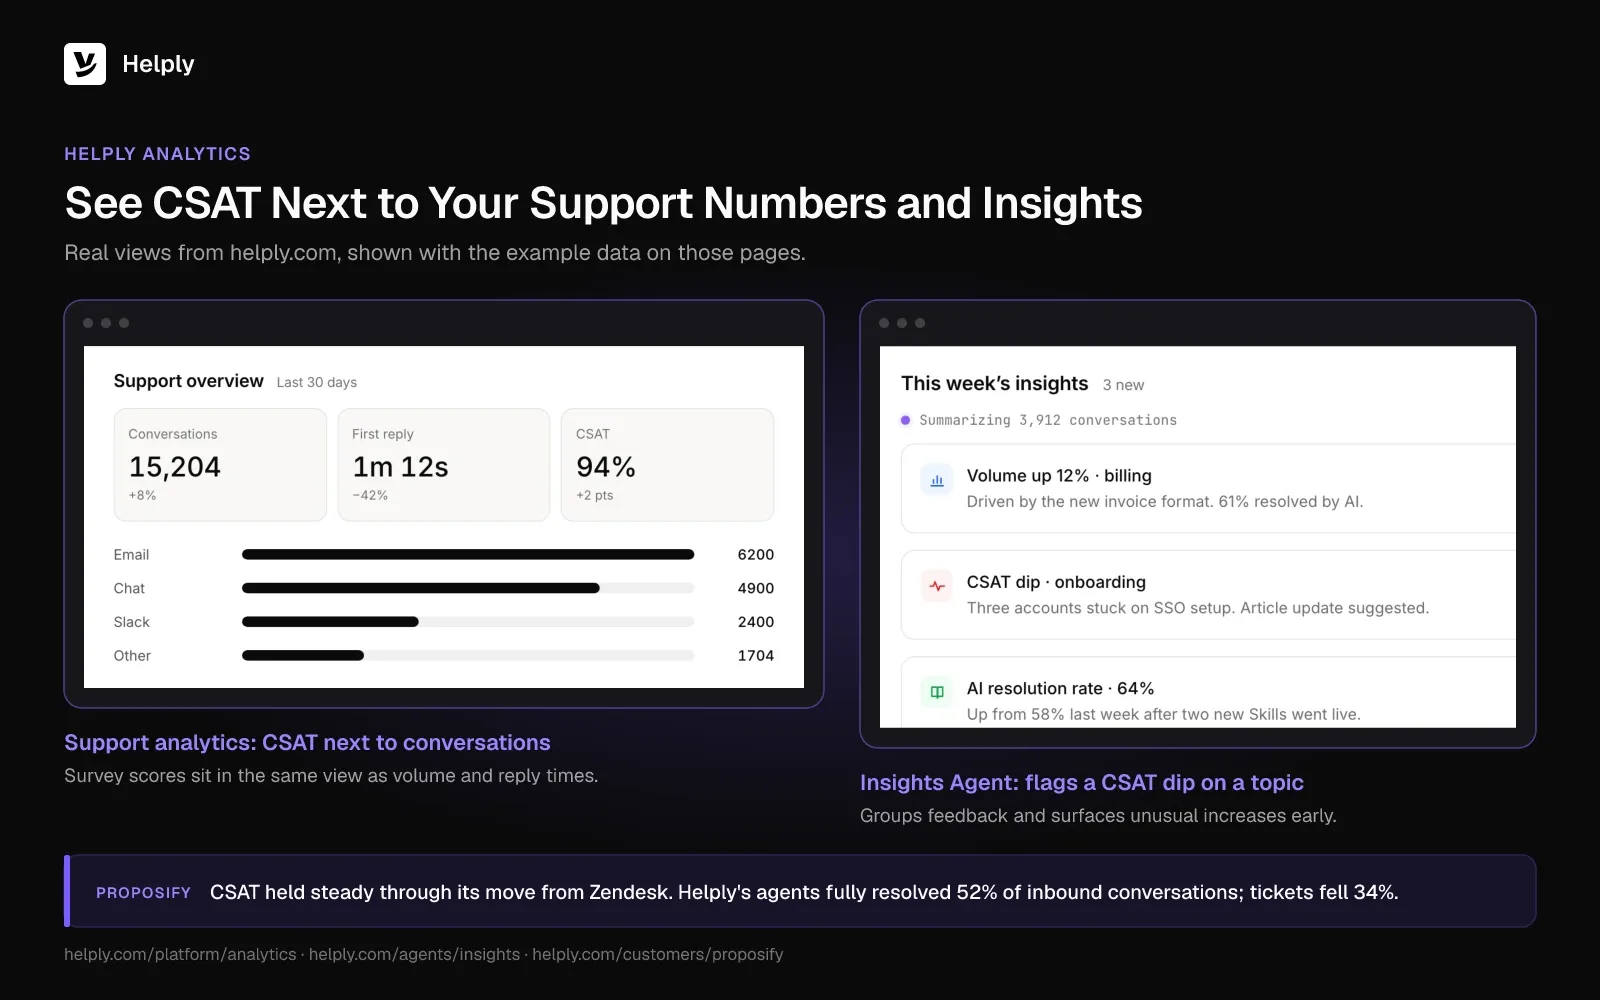
To find what's behind a falling score, the Insights Agent groups similar questions, complaints and feedback across customers. It flags unusual increases in a topic before they become obvious.
The Support Agent escalates conversations it can't confidently resolve. Your team receives what it already found about the issue and the customer. The Churn Agent watches conversations for frustration and sentiment changes and can alert the right teammate.
Proposify moved support for both of its products from Zendesk to Helply, and its CSAT held steady through the move. Helply's agents fully resolved 52% of Proposify's inbound conversations while total ticket volume fell 34%. Read the Proposify story.
Survey Tool or Help Desk: Where Should Your CSAT Survey Live?
Keep your CSAT survey in your help desk if support drives most of your ratings. Use a dedicated survey tool if you also survey after purchases, onboarding and product use.
The roundup of customer satisfaction survey tools compares the main options. On Helply's plans, CSAT surveys start on Plus, the Insights Agent on Team and the Churn Agent on Pro.
Is 85% CSAT Bad?
An 85% score sits 0.2 points under the Freshworks ticket median of 85.2%. On 40 ratings, the drop from 90% is two customers, inside a margin of error of about 11 points.
The number comes from one formula: (4s + 5s) ÷ total × 100, so 34 satisfied ratings out of 40 gives 85%. Count the reasons in question 12 to decide what to change.
Start this week. Read the six ratings below 4 and follow up on any 1s and 2s. Give the score a month before you judge the trend.
Frequently asked questions
A CSAT survey asks a customer to rate one interaction, usually from 1 (very dissatisfied) to 5 (very satisfied). The CSAT score is the percentage of ratings that are 4 or 5.
One rating question plus one or two follow-ups. Survicate's 2025 data shows completion of 86.3% for 2-question surveys and 74.2% for surveys of 4 to 10 questions. Completion rises again for surveys of 11 to 20 questions.
80% is a mid-range CSAT score. It matches Survicate's 2025 median for CSAT surveys and sits below the 85.2% ticket median in Freshworks' 2024 benchmark.
Published CSAT benchmarks report a percentage, so compare your percentage rather than your average out of 5. In one example, 200 ratings averaging 4.34 out of 5 gave a CSAT score of 86%.
Yes, against the published medians. 90% beats the Freshworks ticket median (85.2%) and Survicate's 2025 median (80.0%). Among Simplesat customers, nearly two-thirds of companies score 90% or higher, so 90% is common there.
The highest CSAT score is 100%, which means every respondent picked a 4 or a 5. Small samples reach 100% more often, so read a perfect score next to its response count.
CSAT = (4 and 5 ratings ÷ total ratings) × 100. For example, 172 satisfied ratings out of 200 gives 86%.
The five levels are very dissatisfied, dissatisfied, neutral, satisfied and very satisfied. Only the top two, known as the top-two box, count toward the CSAT score.
Teams use three surveys: customer satisfaction score (CSAT), customer effort score (CES) and Net Promoter Score (NPS). They read them alongside behavior like repeat contacts and churn. CSAT covers single interactions, CES covers effort and NPS covers loyalty.
A response rate above 7.5% beats Survicate's 2025 median across 560 CSAT surveys. Delighted's 2021 data showed 6% for email surveys, 8% for website surveys and 16% for in-app surveys on iOS.
About the author

Bildad Oyugi
Head of Content
Bildad is a digital marketing expert with over 5 years of experience in copywriting, content marketing, and editing. Outside of work, he enjoys videography and spending time with his family.
Keep reading

What Is a Customer Service Center? Types, Tools and How to Set One Up
Jared Scheel · 14 min read
What Is a Support Ticket? Fields, Statuses, Types and Examples
Konrad Janczyk · 15 min read