
 Konrad Janczyk ··8 min read

What Is a Customer Support Dashboard?
A customer support dashboard pulls metrics from your help desk into one view. It shows how fast the team answers, how much work is waiting and whether customers leave satisfied. Teams also call it a customer service KPI dashboard.
Support analytics is the wider practice of reading those numbers to find causes. A dashboard answers "what is happening right now". Analytics answers "why did it happen, and what should change".
A dashboard works when one audience can act on every tile. An agent needs the next conversation to pick up, and an executive needs the trend that changes a budget or a hire. Mix both on one screen and each reader scrolls past tiles meant for someone else.
Customer Service Metrics and KPIs Every Dashboard Draws From
Each customer service KPI below belongs on at least one dashboard. The table defines each one once, with its formula, refresh rate and owning view.
Customer Service KPIs by Formula, Refresh Rate and Dashboard
| KPI | How to calculate it | Refresh | Dashboard |
|---|---|---|---|
| First response time | Time from a customer's first message to the first human or AI reply, as a median | Live | Team, manager |
| Resolution time | Time from first message to resolved, as a median | Daily | Manager, exec |
| SLA attainment | Conversations answered or resolved inside target ÷ all conversations × 100 | Live | Team, manager |
| Backlog | Open conversations at a set time each day | Daily | Team, manager |
| Reopen rate | Resolved conversations the customer reopens ÷ resolved conversations × 100 | Weekly | Manager, AI |
| CSAT | Satisfied responses (4 or 5 on a 5-point scale) ÷ all responses × 100 | Weekly | Manager, exec, AI |
| NPS | % promoters (9 or 10) minus % detractors (0 to 6) | Quarterly | Exec |
| AI resolution rate | Conversations AI resolves with no human reply and no reopen within 7 days ÷ all conversations AI handled × 100 | Weekly | AI, exec |
| Deflection rate | Self-service sessions with no ticket opened afterward ÷ all self-service sessions × 100 | Weekly | AI (context only) |
| Handoff rate | Conversations AI passes to a person ÷ conversations AI handled × 100 | Weekly | AI, manager |
| Cost per resolution | Total support cost for the period ÷ resolved conversations | Weekly | Exec |
CSAT follows the Qualtrics formula, and NPS follows Bain's Net Promoter System. For agent-level scorecards, see the support agent performance metrics guide.
Example 1: The Team Dashboard for Agents on Shift
The team dashboard runs on a wall screen or a pinned tab during the shift. Each tile tells an agent which conversation needs a reply next.
- Open conversations by channel: email, chat and messaging counts, refreshed live.
- Oldest waiting conversation: the age of the longest wait, in minutes.
- First response time today: the median against the SLA target, colored when it slips.
- SLA breaches in the next hour: a short list agents can claim.
- Assigned to me: each agent's own open count.
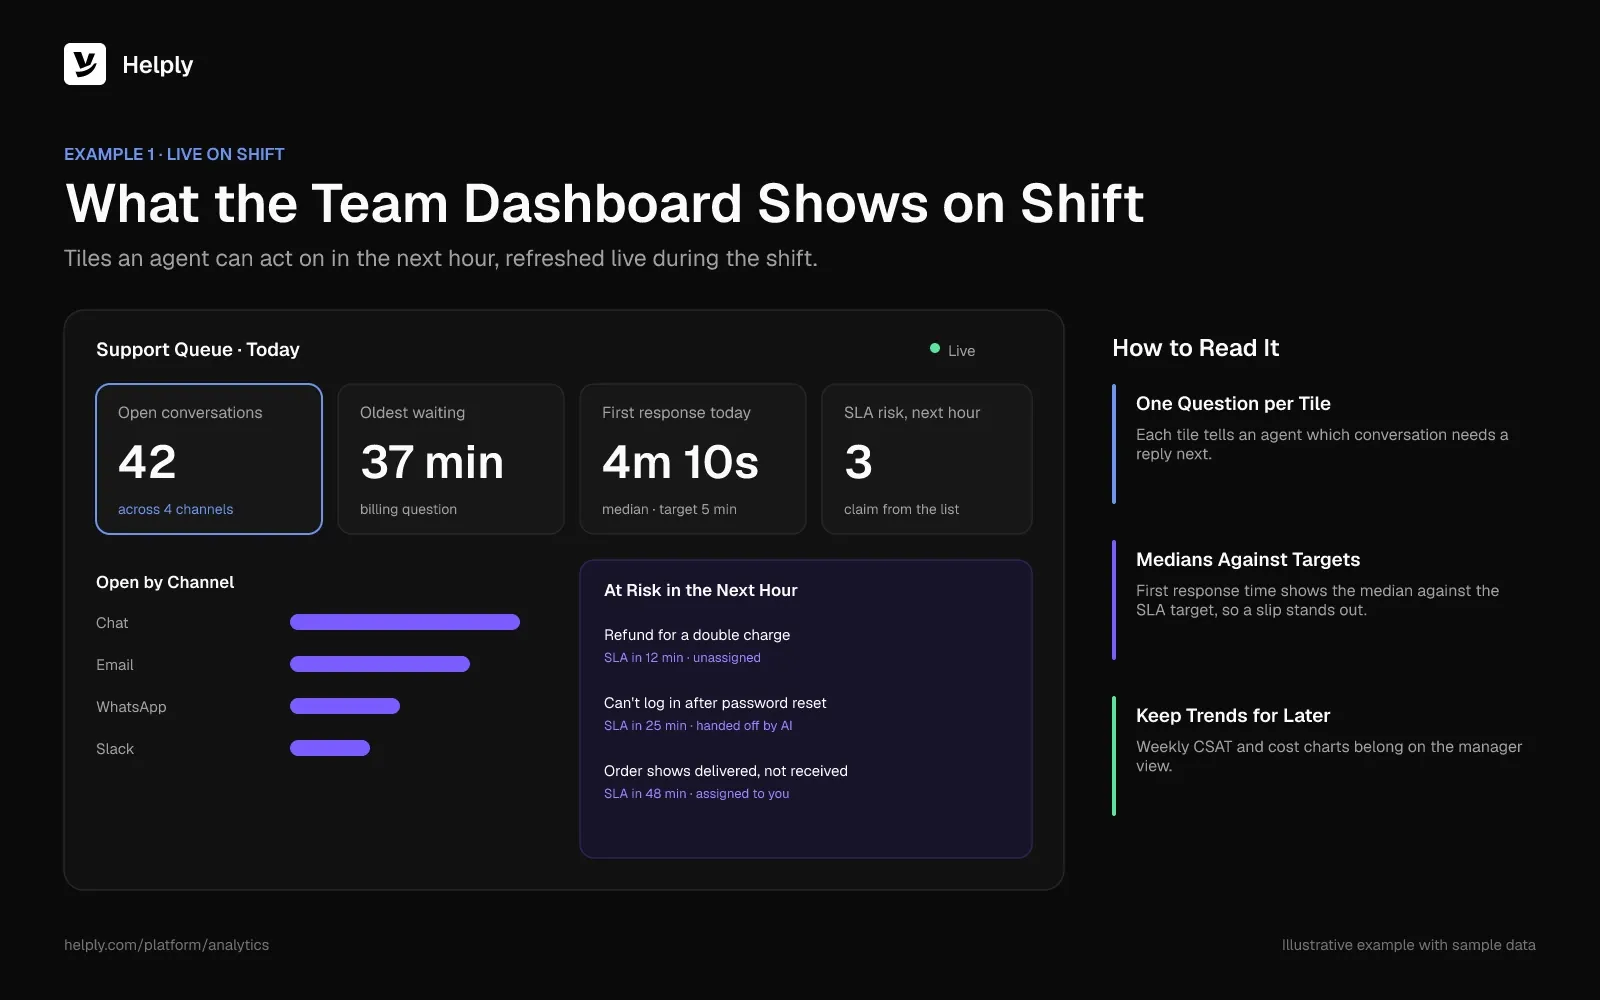
Leave weekly CSAT and cost charts off this screen. Agents can't act on a trend during a shift, and those charts push the urgent tiles below the fold.
Speed still deserves the top spot. In Salesforce's 2023 State of the Connected Customer survey, 77% of customers said they expect to interact with someone immediately.
Example 2: The Support Manager Dashboard
The manager dashboard covers the week. It explains why the queue moved and which lever to pull next.
- Backlog trend: open conversations at 9am each day, with new and resolved counts beside it.
- Median resolution time by topic: billing, bugs, how-to and account changes, so slow categories stand out.
- CSAT with comments: the score plus the five lowest-rated conversations to read.
- Reopen rate: a rise here means agents or AI closed tickets without fixing the problem.
- Load per agent: assigned conversations against capacity, to rebalance before burnout.
- AI handoffs by reason: which requests the AI passed to a person this week.
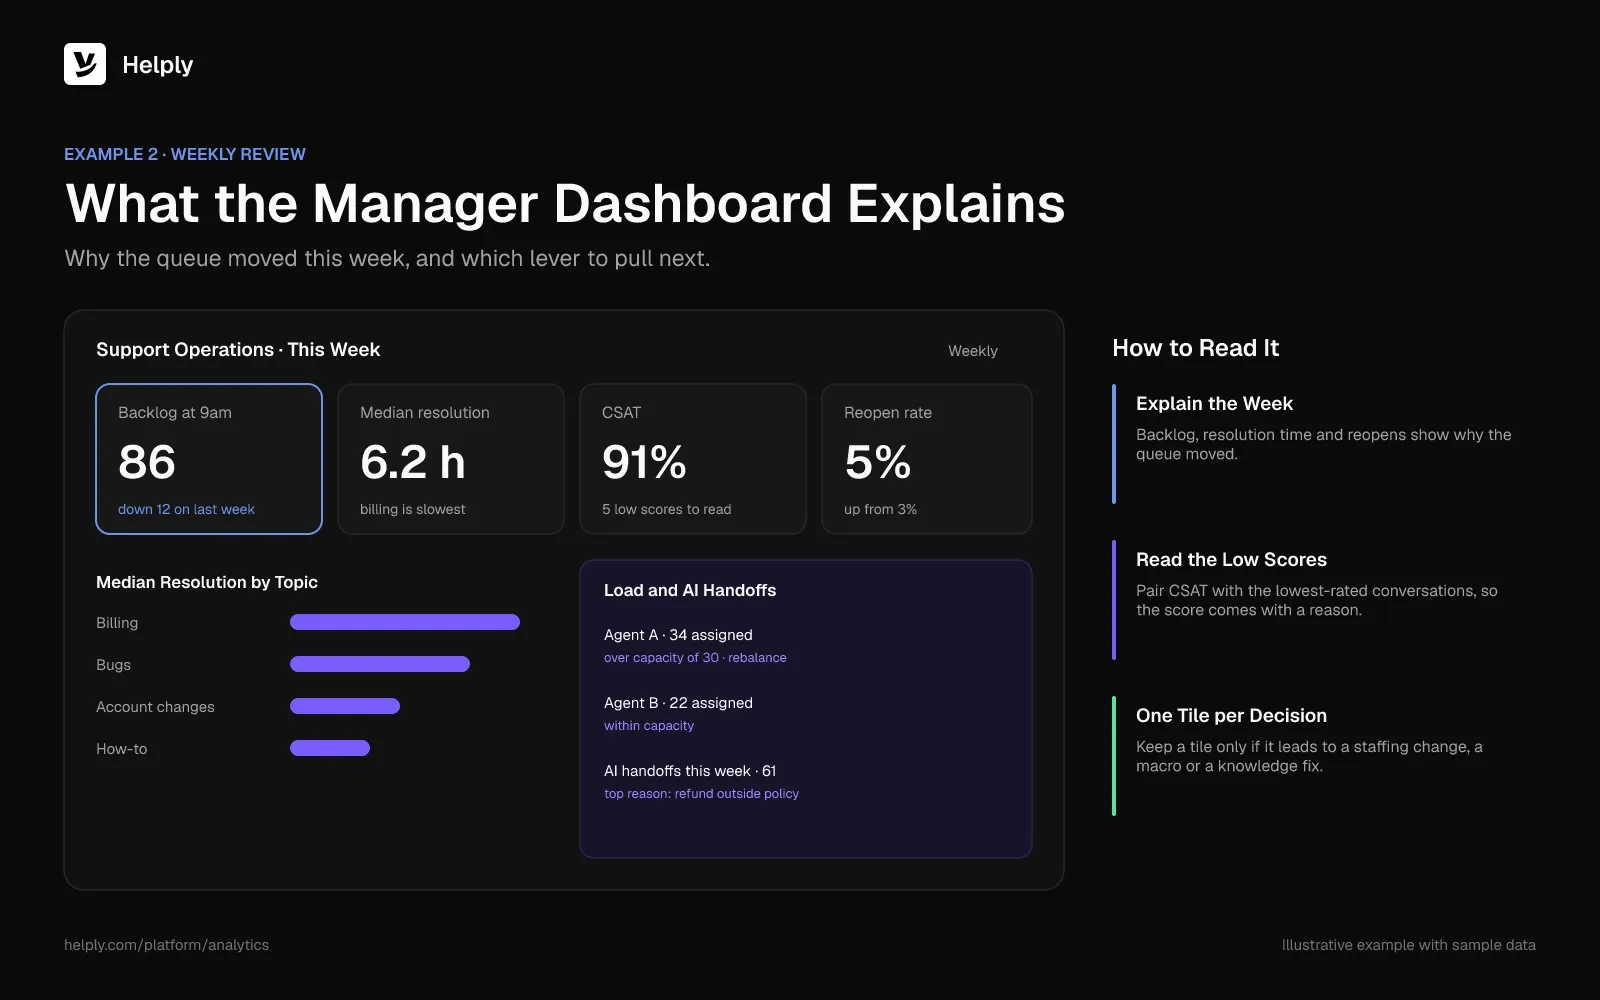
Add one tile per decision the manager owns. If no tile leads to a staffing change, a macro or a knowledge base fix, drop it.
Example 3: The Executive Support Dashboard
Executives read this view once a month. It connects support to cost, retention and product quality.
- Conversation volume trend: monthly totals, with volume per active customer to separate growth from new problems.
- CSAT and NPS trend: a 6 to 12 month line, so one bad month reads in context.
- Cost per resolution: total support cost divided by resolved conversations.
- Share of work AI resolves: the AI resolution rate as a share of all conversations.
- Top contact reasons: the five topics driving volume, for the product team.
- Accounts with repeat issues: customers contacting support often about the same problem.
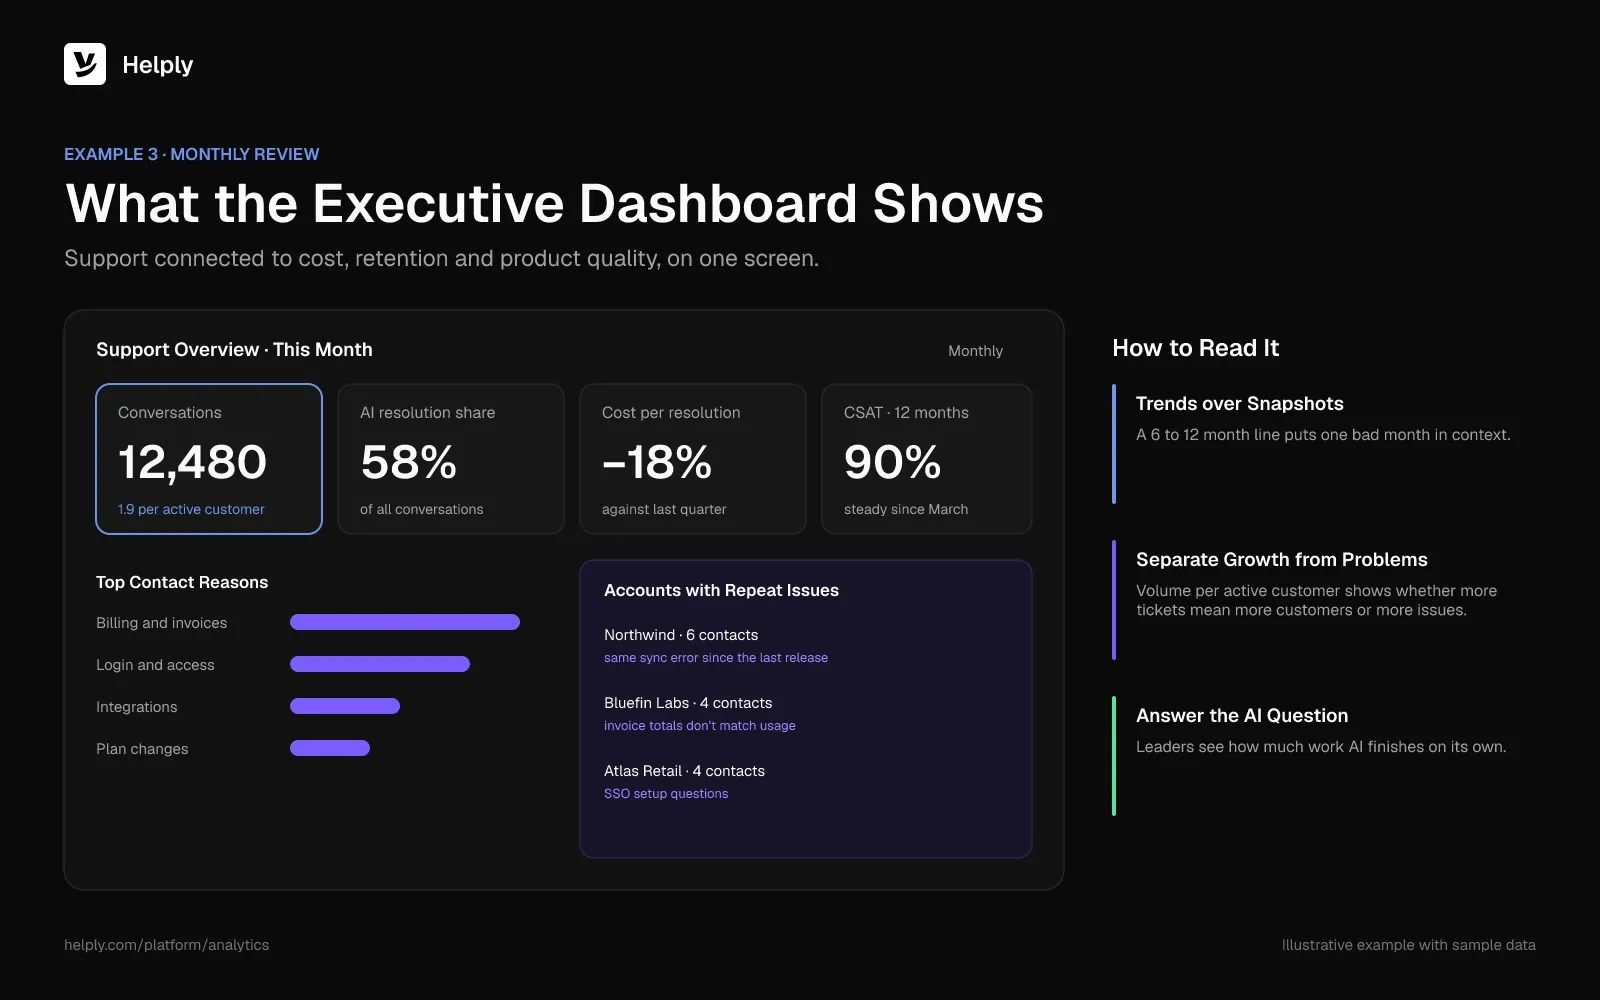
Executives now also ask whether the AI is working. In a March 2025 forecast, Gartner said that by 2029, agentic AI will settle 80% of routine service issues with no human involved. Put the AI resolution rate on this screen so executives can see how close the team is.
Example 4: The AI Agent Dashboard
AI needs its own view because it fails differently from people. People close few conversations by mistake. A weak AI setup can mark conversations as handled while customers leave without an answer.
- AI resolution rate: conversations resolved with no human reply and no reopen within 7 days.
- Handoff rate and reasons: what the AI passed to a person, grouped by topic.
- Reopens after an AI answer: the check that catches false resolutions.
- CSAT on AI conversations vs. human ones: the same survey, split by who answered.
- Knowledge gaps: questions the AI couldn't answer because no article covered them.
- Actions taken: refunds, plan changes or lookups the AI completed in other tools.
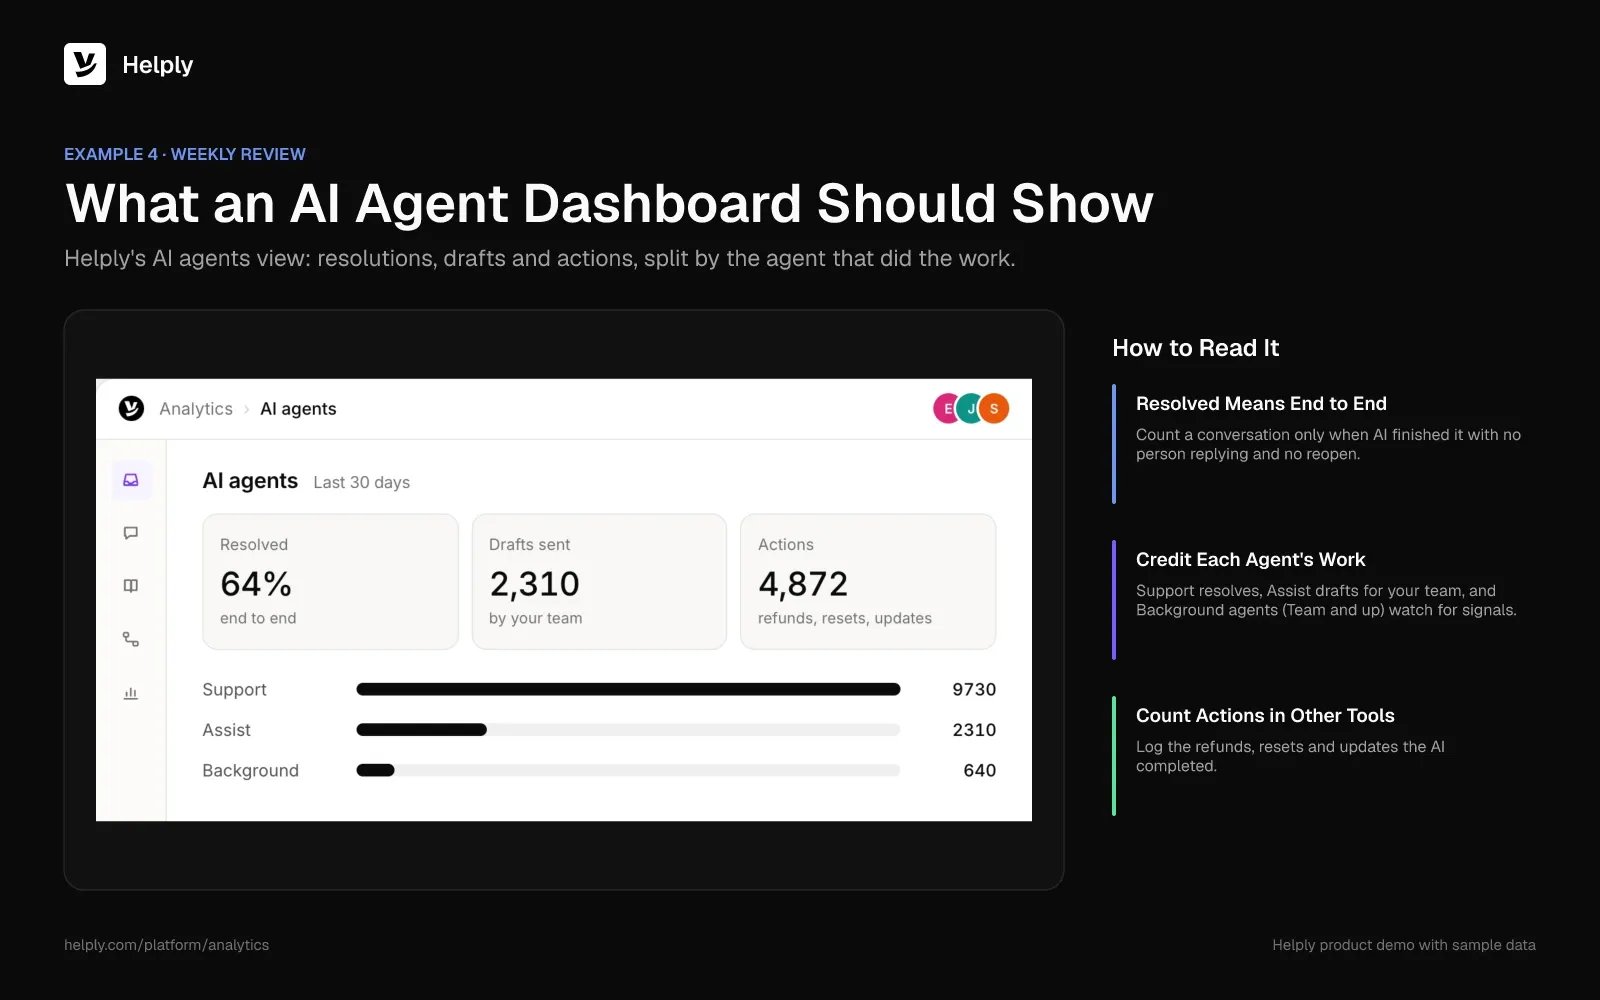
Intercom's Customer Service Transformation Report, published in January 2026, surveyed over 2,400 support professionals. Only 10% of teams said they had reached a mature AI deployment.
At that mature stage, the share of teams reporting better metrics from AI rises from 62% to 87%. Put AI handoffs on the dashboard, and the team gets a list of fixes to make next.
For tiered AI benchmarks and ROI formulas, see the guide to AI customer support KPIs.
Why Deflection Rate Misleads on Its Own
Deflection counts customers who saw a bot answer or help article and didn't open a ticket. It can't tell a solved problem from a customer who gave up.
Gartner polled 5,728 customers for the survey it published in August 2024. Even issues customers called "very simple" reached only a 36% self-service resolution rate.
A high deflection rate next to flat CSAT can mean customers left without help.
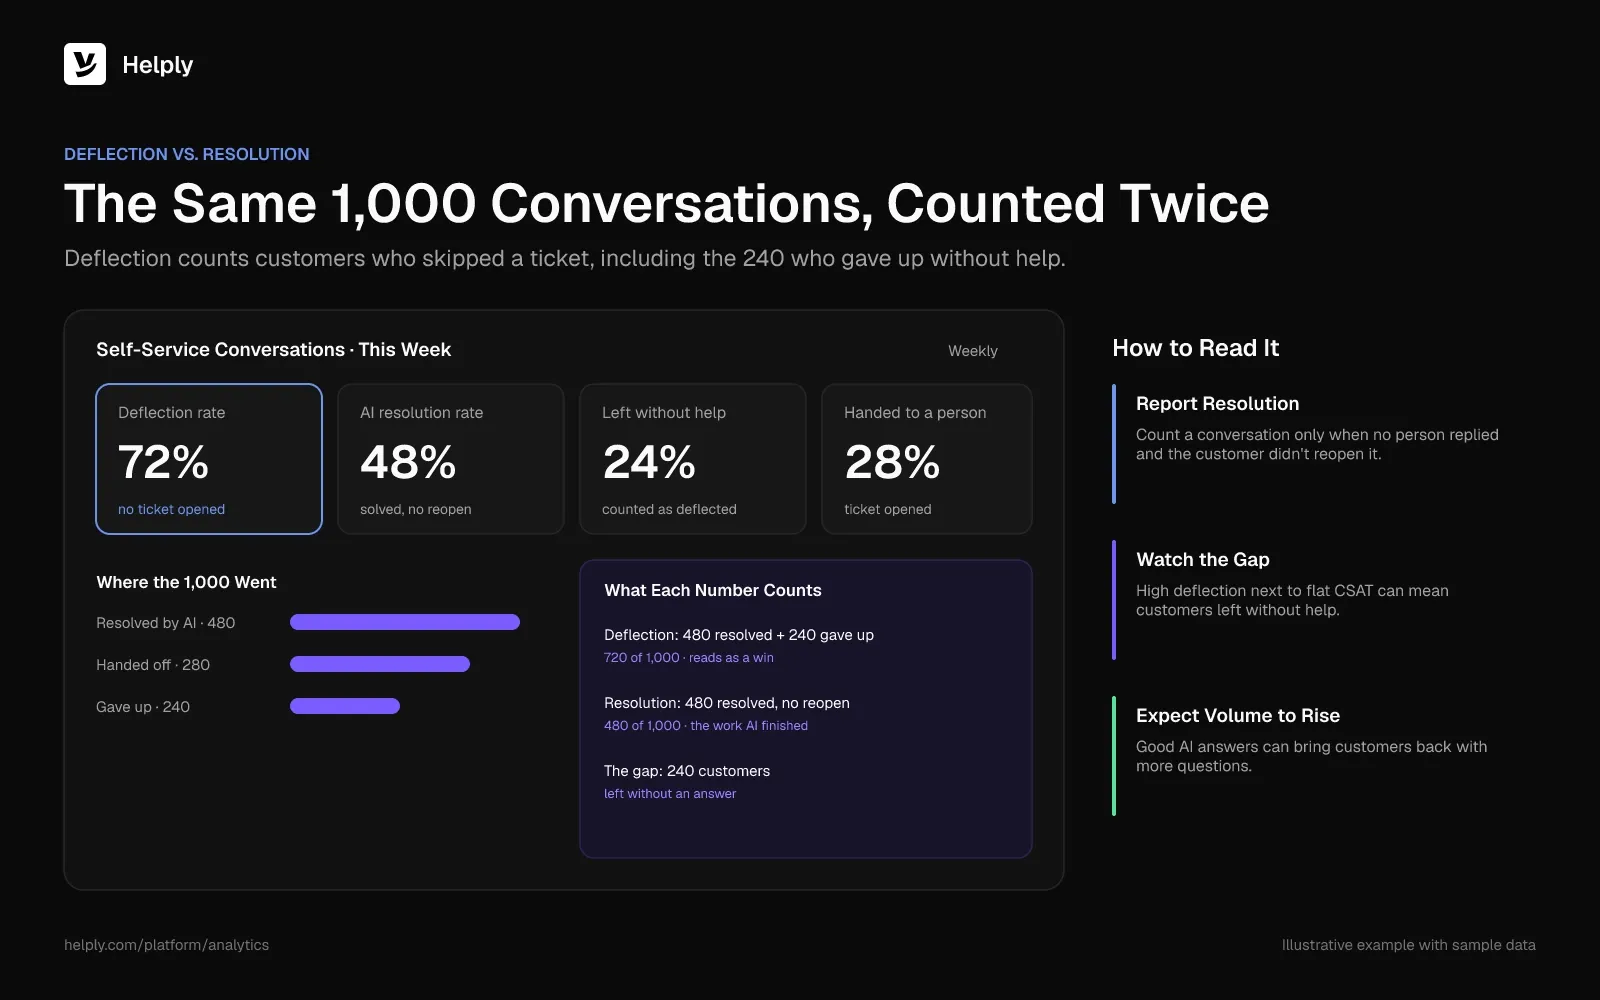
Good AI answers can also raise volume, and a deflection rate counts that rise against you. After Kameleomoved support to Helply, engagement doubled as customers asked more. Helply handled more conversations than the old Zendesk queue ever received.
Judged by deflection, that rise looks like failure. Kameleo's customers asked more because Helply gave instant, accurate technical answers.
How to Build a Customer Support Dashboard in 5 Steps
- Name the audience and the decision. Write one sentence per dashboard: "The manager uses this every Monday to rebalance the team."
- Pick five to eight KPIs. Choose from the table above, and give each one a target and an owner.
- Define every formula before you build. Agree on what counts as resolved, how reopens work and how AI replies affect first response time.
- Set the refresh rate to the decision. Live for the team view, daily or weekly for managers, monthly for executives.
- Review the dashboard every quarter. Remove any tile that led to no action last quarter, and add the question leadership asked that the dashboard couldn't answer.
Dashboard Mistakes That Hide Real Problems
- Averages instead of medians. One conversation open for three weeks drags the average resolution time up and hides the typical case.
- First response time without resolution time. An instant autoreply improves the first number and does nothing for the customer.
- One CSAT score for humans and AI. A blended number can hold steady while AI satisfaction drops.
- Volume without context. Rising volume can mean product problems or a growing customer base. Volume per active customer separates the two.
- No link from a number to a fix. A handoff spike matters only if someone can see which article is missing.
Build It in a BI Tool or Read It in Your Help Desk?
A BI tool fits teams with a data analyst and support data spread across several systems. Built-in help desk analytics fits teams that want AI and human numbers in one place without a reporting project.
Helply is an AI-native customer support platform. One system runs its conversations, AI agents and reporting, so it fits the second group.
Helply Analytics shows conversation volume, response times, resolution trends, backlog and customer feedback in one place. Its AI view shows which requests cause escalations and where AI needs human help. Each Support Agent handoff arrives with the investigation done and the customer context ready, so your agent picks up where the AI stopped.
Kameleo's numbers go beyond a resolution rate. Responses ran three times faster, and Helply showed the knowledge base was about 70% complete. Helply then drafted articles to close the biggest gaps.
From Team up, the Knowledge Agent spots answers your docs lack, and the Insights Agent uncovers recurring problems for product and leadership.
Standard reports come on every plan, and CSAT surveys start on Plus. Custom reports, NPS, SLA reports and AI QA start on Team.
Custom dashboards, AI reports and anomaly detection come on Pro and up. Compare Helply plans to see which reports each one includes.
Frequently asked questions
The main KPIs in customer service are first response time, resolution time, SLA attainment, backlog, reopen rate, CSAT and NPS. Teams using AI add AI resolution rate, handoff rate and CSAT on AI conversations. Pick five to eight per dashboard based on who reads it.
Support analytics is the practice of reading help desk data to find why support performance changes. A dashboard shows what is happening, and analytics explains the cause, such as a missing article behind a rise in handoffs.
A customer service dashboard should include only the metrics its audience can act on. Agents need the live queue and SLA risk, managers need weekly trends and load, and executives need volume, satisfaction, cost and AI resolution.
A team dashboard should update live, and a manager dashboard should refresh daily for a weekly review. An executive dashboard should update monthly. Match the refresh rate to how often the reader makes a decision from it.
Deflection rate counts customers who didn't open a ticket after seeing self-service content. AI resolution rate counts conversations the AI resolved with no human reply and no reopen. In an August 2024 Gartner survey, self-service fully resolved only 14% of customer service issues.
Divide the number of satisfied responses (4 or 5 on a 5-point scale) by all survey responses, then multiply by 100. Split CSAT by human and AI conversations so one can't hide a drop in the other.
An executive support dashboard should show volume, CSAT or NPS trends, cost per resolution, AI resolution share and top contact reasons. Keep it to one screen that someone reviews monthly.
About the author

Konrad Janczyk
Staff Software Developer
Keep reading

9 HubSpot Service Hub Alternatives That Keep Your CRM
Bildad Oyugi · 12 min read
Front Alternatives: 8 Support Tools Priced for a Five-Person Team
Jared Scheel · 24 min read