
 Bildad Oyugi ··9 min read

Your survey export has 137 rows, and the CEO wants one number for the board deck by Friday. Your spreadsheet shows 5.84, a colleague rounds it to 6, and you can't tell if either counts as good.
Start with the formula, then check your score against B2B SaaS benchmarks and your detractors' ticket history. Our guide to measuring KPIs for AI customer support covers the metrics to track beside NPS.
What Does NPS Mean?
NPS stands for Net Promoter Score, a loyalty metric built on one survey question. Fred Reichheld introduced it in "The One Number You Need to Grow," in Harvard Business Review in December 2003. Satmetrix and teams from Bain & Company helped him develop it.
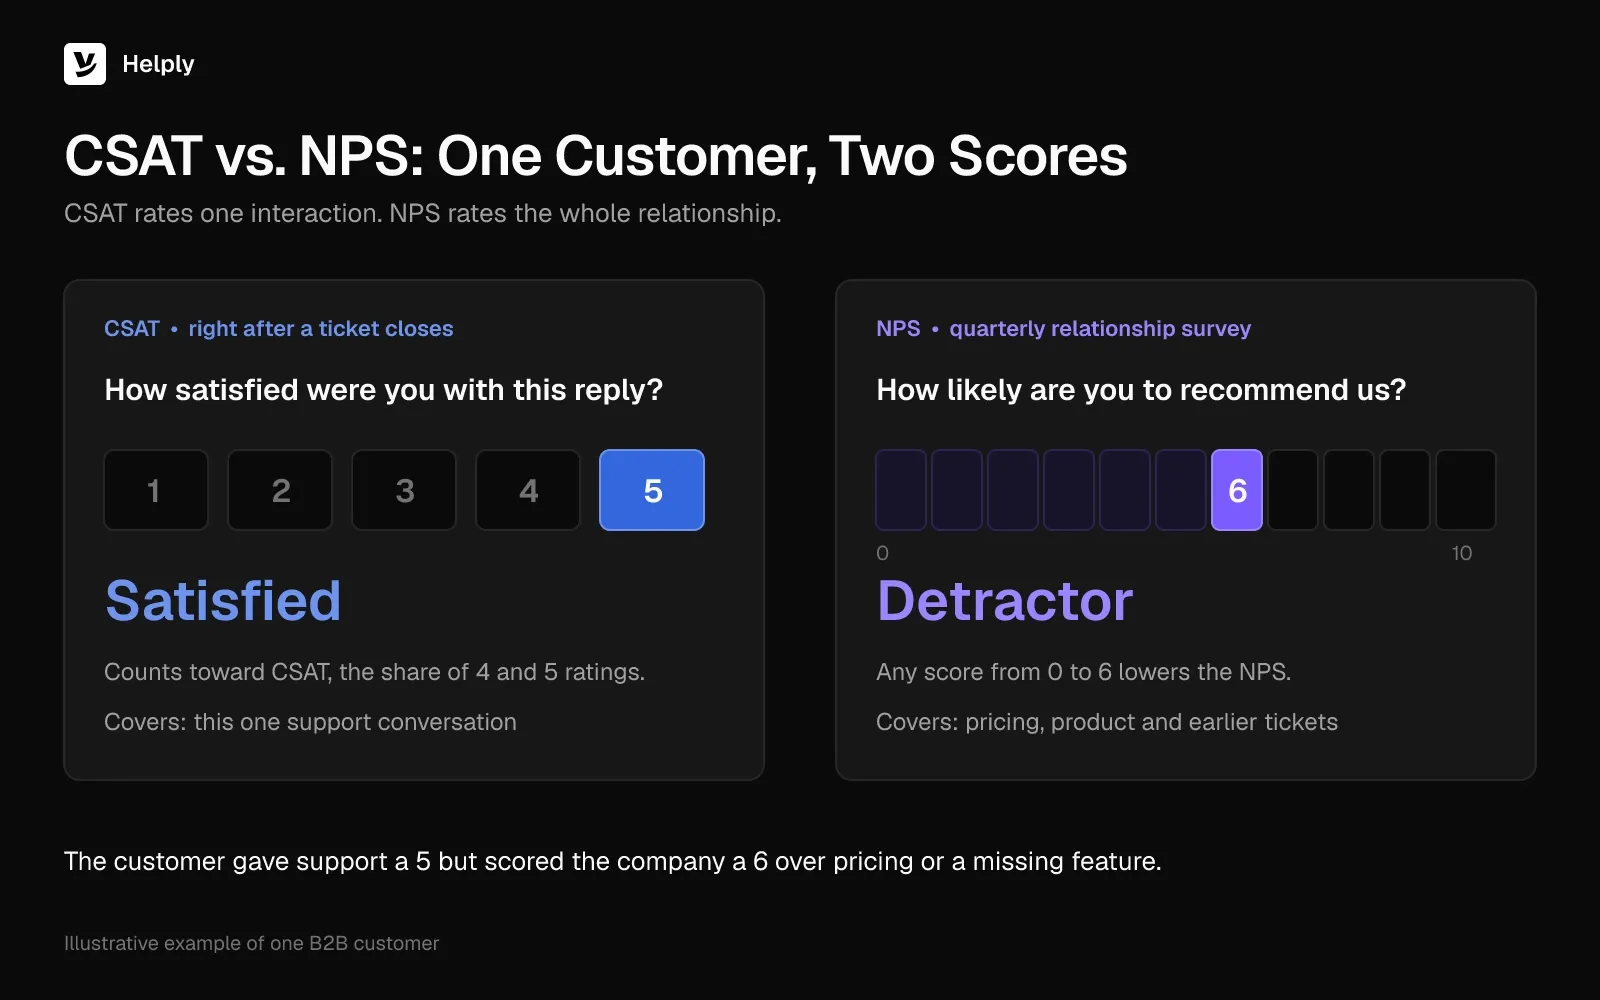
The question asks about recommending the company, so customers score the whole relationship. A buyer can like your last support reply and still answer with a 5. That makes NPS a relationship metric, while CSAT scores a single interaction.
Promoters, Passives and Detractors
Bain splits answers into three groups and ties each to behavior:
- Promoters score 9 or 10, and Bain says they "account for more than 80% of referrals in most businesses."
- Passives score 7 or 8, and their repurchase and referral rates run as much as 50% lower than promoters', per Bain.
- Detractors score 0 to 6, and Bain says they "account for more than 80% of negative word of mouth."
Passives count toward total responses, but the formula leaves them out of the subtraction. A survey full of 7s and 8s lands near zero, even with few unhappy customers.
Bain & Company, NICE Systems and Fred Reichheld hold the registered trademarks for Net Promoter, NPS and Net Promoter System. Net Promoter Score is a service mark.
How to Calculate NPS: The NPS Formula
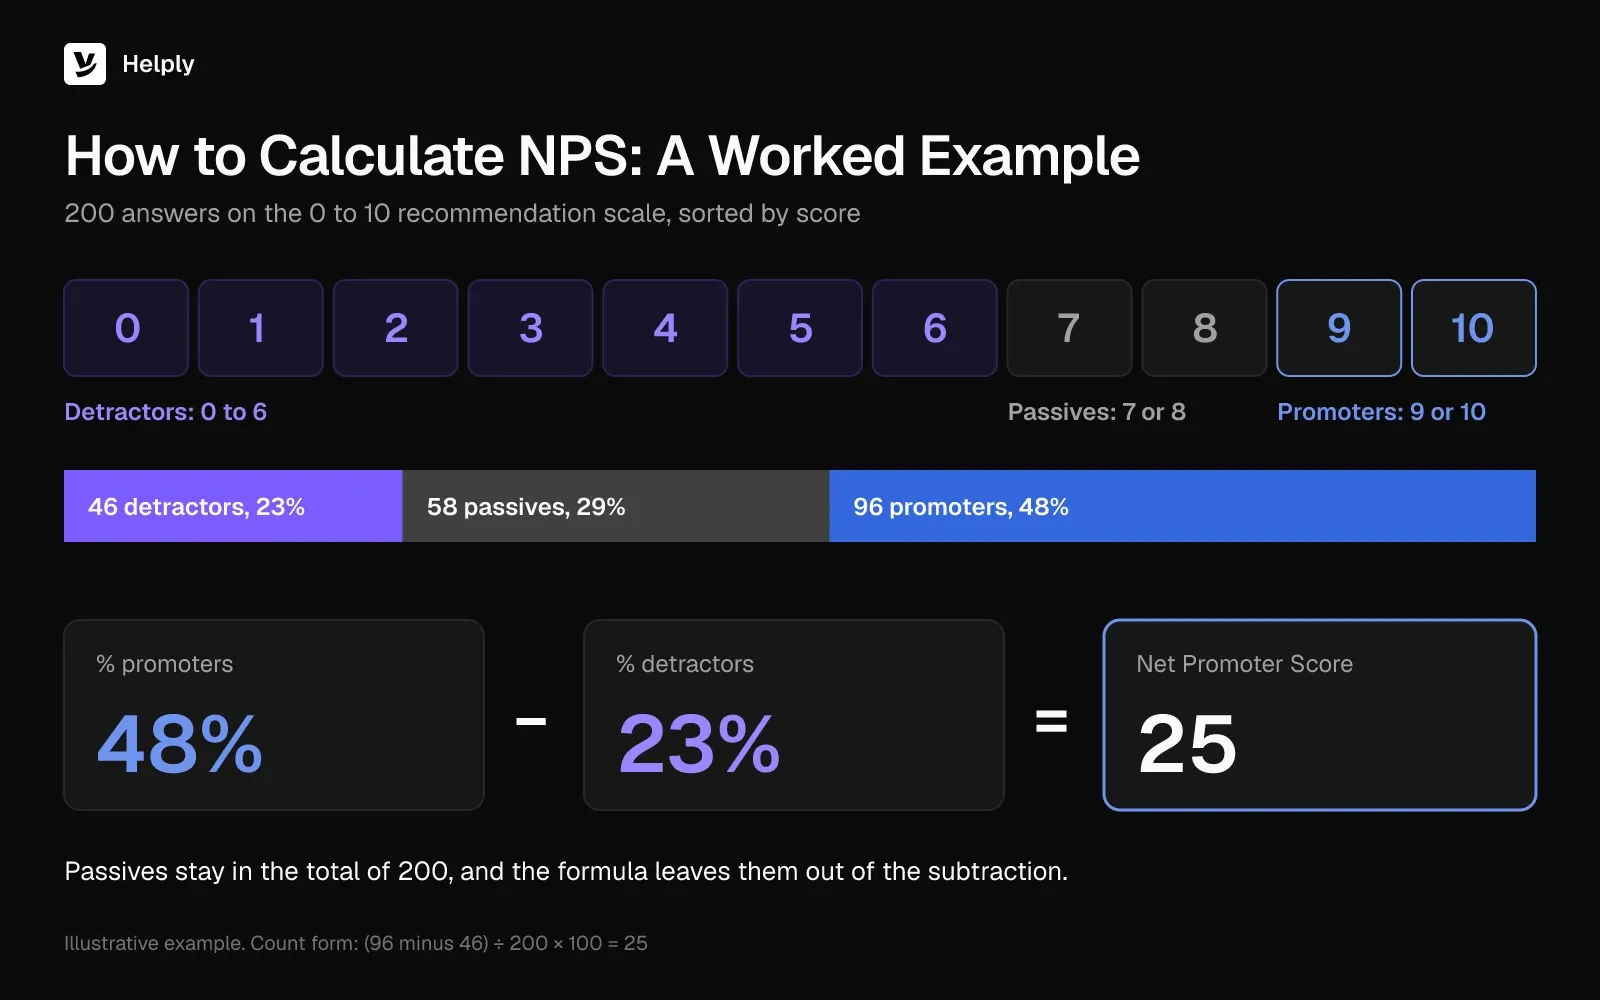
The NPS formula fits on one line: promoter share (9 or 10) minus detractor share (0 to 6).
The count version gives the same number: NPS = (promoters minus detractors) ÷ total responses × 100. Report the result as a score without a percent sign, as in "an NPS of 25."
Scores range from minus 100, when every respondent is a detractor, to plus 100, when every respondent is a promoter.
NPS Calculation Example: 200 Responses
Say a quarterly survey of your B2B customers returns 200 answers.
| Group | Scores | Responses | Share of Total |
|---|---|---|---|
| Promoters | 9 or 10 | 96 | 48% |
| Passives | 7 or 8 | 58 | 29% |
| Detractors | 0 to 6 | 46 | 23% |
| Total | 0 to 10 | 200 | 100% |
- Promoters: 96 ÷ 200 = 48%.
- Detractors: 46 ÷ 200 = 23%.
- NPS: 48 minus 23 = 25.
The count form gives the same result: (96 minus 46) ÷ 200 × 100 = 25.
Rounding: Subtract First, Round Last
Most response counts won't divide into whole percentages. Take 137 responses with 52 promoters, 41 passives and 44 detractors.
Promoters come to 37.96% and detractors to 32.12%. The difference is 5.84, which you report as an NPS of 6.
Rounding each group first gives 38 minus 32, which also lands on 6 here. On other counts, rounding early can shift the result by a point, so keep decimals until the last step.
NPS Formula in Excel or Google Sheets
Put one score per row in column B, from B2 to B201 for 200 responses. Then enter this formula:
=(COUNTIF(B2:B201,">=9")-COUNTIF(B2:B201,"<=6"))/COUNT(B2:B201)*100
The two COUNTIF parts count promoters and detractors, and COUNT supplies the total. Wrap the formula in ROUND(…,0) to report a whole number, and change the range to fit your sheet.
Sample Size and Margin of Error
A small B2B customer base makes NPS noisy. In the 200-response example, the 95% margin of error comes to about plus or minus 11 points. The calculation uses the promoter and detractor shares, 48% and 23%, and the 200-response count.
A drop from 25 to 21 next quarter sits inside that margin and may be noise. Track the trend across several surveys before you act on a move of a few points. Segments with a few dozen responses swing even further.
What Is a Good NPS Score for B2B SaaS?
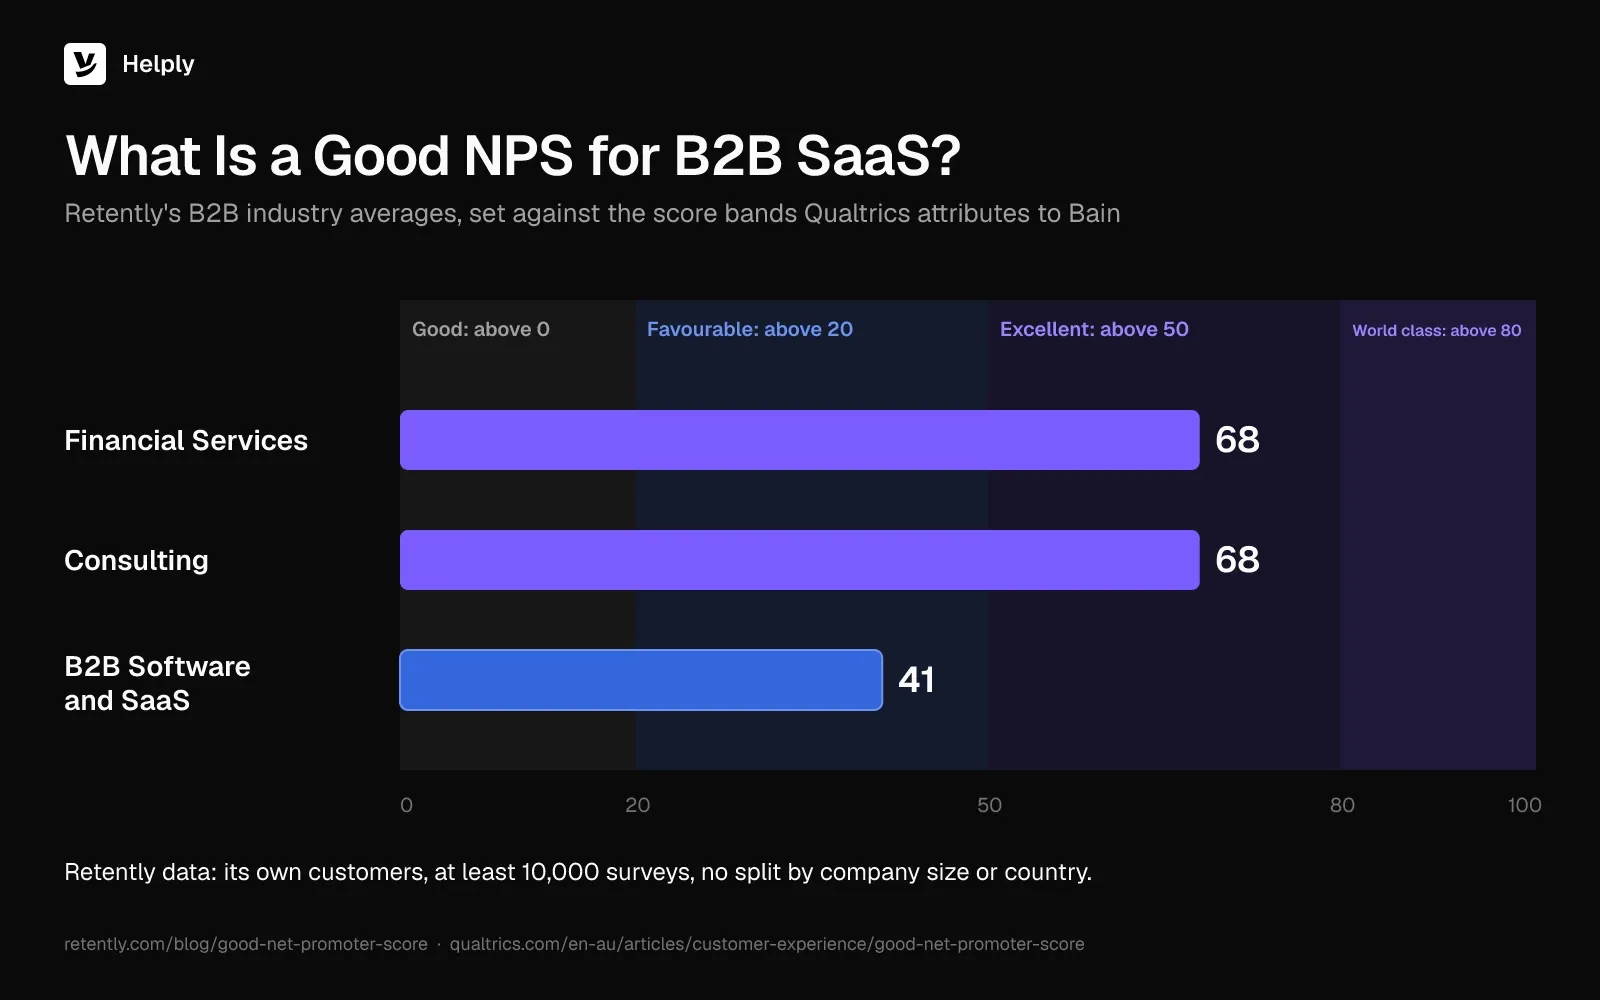
Any score above zero means promoters outnumber detractors. Qualtrics, citing Bain, sorts scores into four bands.
NPS Bands from Qualtrics, Citing Bain
| NPS Band | Label |
|---|---|
| Above 0 | Good |
| Above 20 | Favourable |
| Above 50 | Excellent |
| Above 80 | World class |
Source: Qualtrics, citing Bain & Company.
B2B NPS Averages by Industry (Retently, April 2026)
Retently's benchmark, published in April 2026, reports these B2B averages:
| Industry | Average B2B NPS |
|---|---|
| Financial Services | 68 |
| Consulting | 68 |
| B2B Software and SaaS | 41 |
Source: Retently NPS benchmark, published in April 2026, from at least 10,000 surveys of its own customers.
Retently says B2B industry averages "range from 41 to 68."
Its benchmark includes only industries with more than 10 clients and doesn't split results by company size or country.
Is 25 a Good NPS Score?
A 25 sits above zero and inside the "favourable" band that Qualtrics cites from Bain. It trails the B2B Software and SaaS average of 41 by 16 points. Treat it as a baseline and measure it each quarter.
Is 40 a Good Net Promoter Score?
Retently's B2B Software and SaaS average is 41, so a 40 matches it. It clears the "favourable" band, and reaching "excellent" takes a score above 50. Each detractor you turn into a passive lifts the score as much as each passive you turn into a promoter.
Is 70 a Good NPS Score?
A 70 beats every B2B industry average in Retently's 2026 benchmark, where the top average was 68. Check the response count first. In the 200-response example above, the margin of error was about plus or minus 11 points.
NPS vs. CSAT: Which Metric Answers Which Question?
CSAT scores one interaction. Qualtrics calls it a "'right here, right now' metric that relates to a specific experience rather than an ongoing customer relationship."
The CSAT formula counts 4 and 5 ratings on a 1 to 5 scale, then divides by total responses. If 180 of 200 ticket ratings are 4 or 5, your CSAT is 90%.
CSAT vs. NPS: Question, Scale, Formula and Timing
| Factor | CSAT | NPS |
|---|---|---|
| What it measures | Satisfaction with one interaction | Loyalty to the whole relationship |
| Survey question | "How satisfied were you with…?" | "How likely is it that you would recommend…?" |
| Scale | 1 to 5 | 0 to 10 |
| Formula | % of 4 and 5 ratings | % promoters minus % detractors |
| Range | 0% to 100% | Minus 100 to plus 100 |
| Common timing | After a ticket closes | Once a quarter or twice a year, per account |
| Typical owner | Support | Customer success and leadership |
A customer can rate a support reply 5 out of 5 and still give your company a 6. That 6 can reflect pricing, a missing feature or an earlier ticket.
Send CSAT after each closed ticket and NPS on a separate schedule per account. Spacing the two keeps one contact from getting both surveys in the same week. For ways to lift the CSAT side, see our guide on how to improve customer satisfaction.
How Does Customer Support Create Detractors?
Gartner surveyed a panel of 6,000 customers for its customer loyalty research. Gartner found two ways support teams build loyalty. They resolve issues "in a low-effort manner" and help customers "derive greater value from the product."
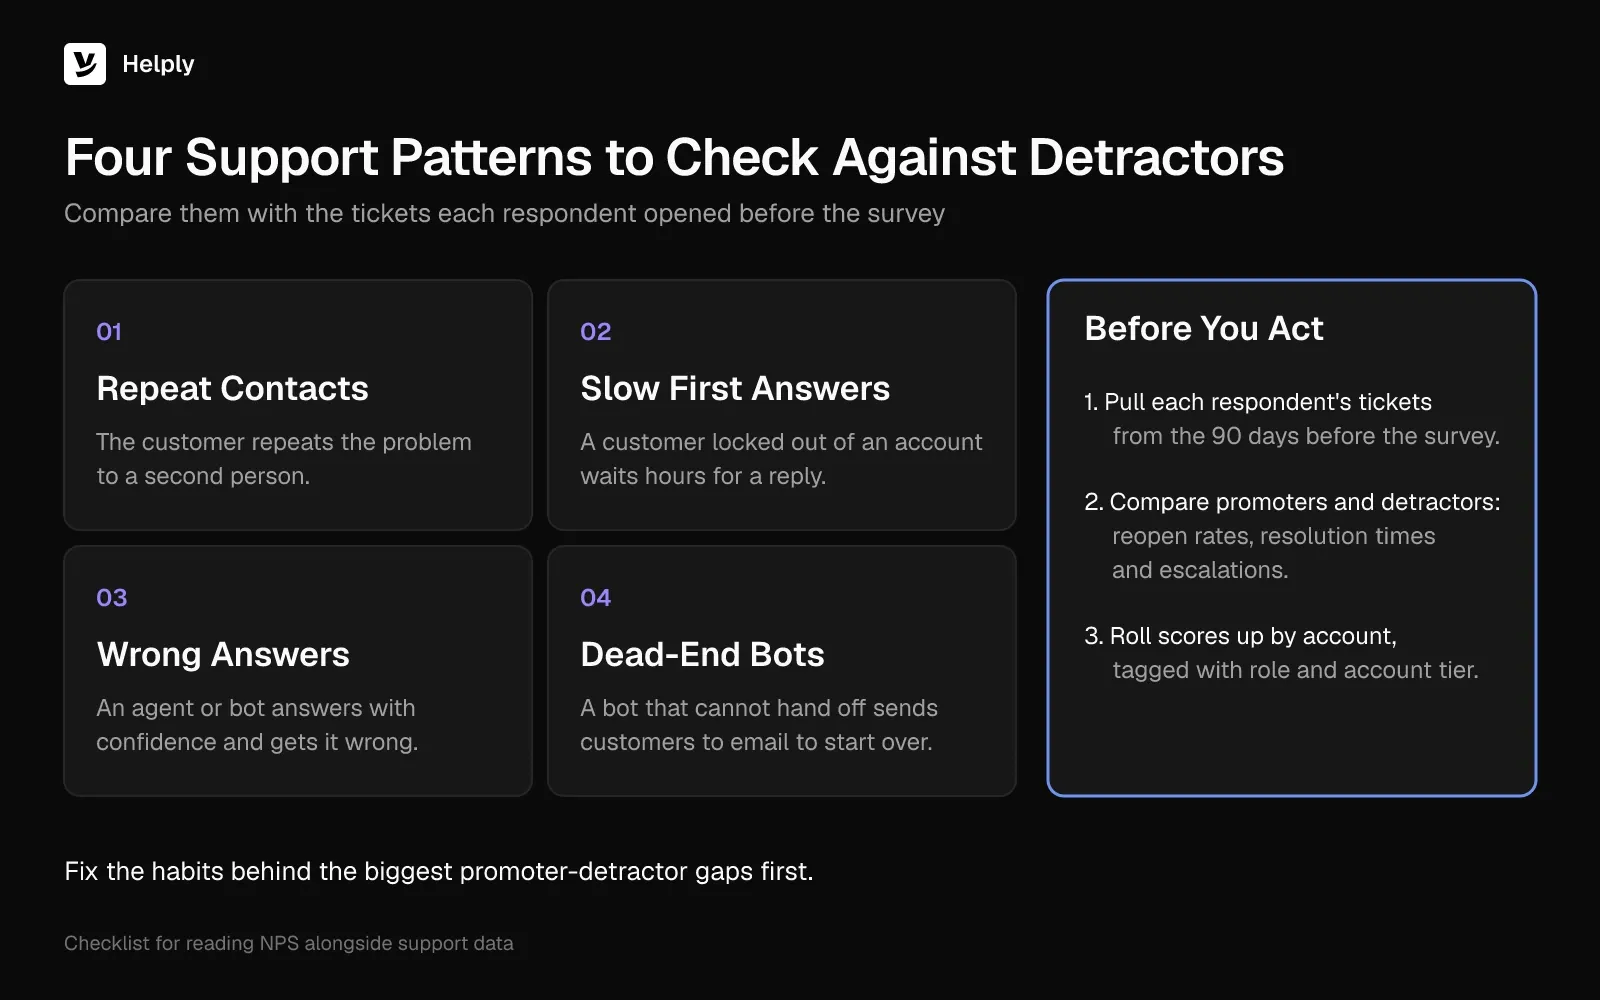
Check your detractor comments for four high-effort support patterns:
- Repeat contacts, where a customer explains the same problem to a second agent.
- Slow first answers, where a locked-out user waits hours for a reply.
- Wrong answers, where an agent or bot replies with confidence and gets it wrong.
- Dead-end bots, where chat offers no handoff and the customer writes an angry email instead.
Covidence set its Support Agent to escalate whenever confidence dropped. In steady-state months, the agent resolved 64% of the team's inbound conversations end to end, and 72% at peak review seasons.
Helply's Covidence case study reports no measurable increase in wrong answers against its human-only baseline, because the agent escalated rather than guessed. Covidence's escalation rule targets two of those patterns: wrong answers and dead-end bots.
Read NPS Alongside Ticket History
Pull each respondent's tickets from the 90 days before the survey. Compare reopen rates, resolution times and escalations for promoters against detractors. Fix the habits behind the biggest gaps first.
In B2B, roll scores up by account as well. Tag every response with role and account tier, so a detractor in the buyer's seat stands out from end users.
Close the Loop with Detractors
Contact each detractor while the survey is fresh, and name one owner in support or customer success. Tag every detractor comment so the product team sees recurring themes. Ask passives what would earn a 9.
After you speak with a detractor, tell them what changed. They then have a reason to answer your next survey.
Track CSAT and NPS Beside the Tickets
Helply puts CSAT and NPS beside the conversations, resolutions and escalations behind each score. Its analyticstrack "conversations, resolutions, response times, escalations, customer feedback, and AI performance."
CSAT surveys start on the Plus plan, and NPS reports start on the Team plan.
- Compare what each plan adds. Every plan includes the Support Agent and Assist Agent.
- The Support Agent can investigate, answer and resolve requests on its own. If it can't resolve a request, it passes the case to a teammate along with its research and the customer's details.
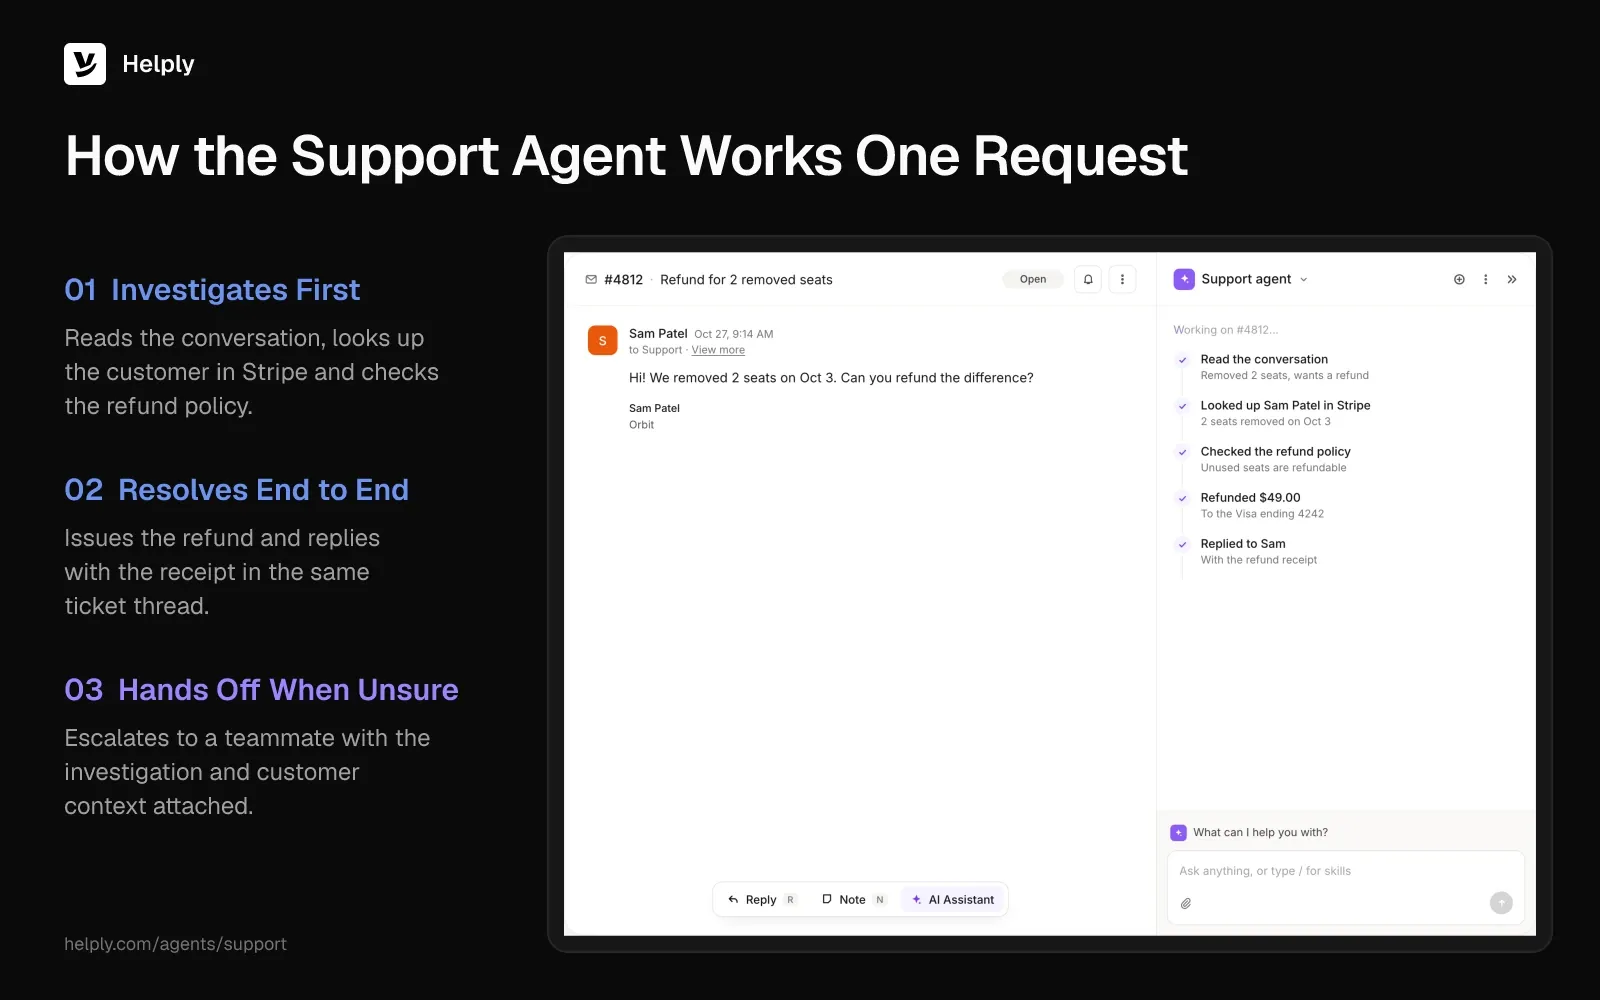
- The Assist Agent prepares reply drafts using the thread, customer context and your own Guidelines.
- From Team, the Insights Agent analyzes conversations for trends and recurring problems. The Knowledge Agent, also from Team, flags gaps and stale articles, and your team can check each one before customers see it.
- On Pro and up, the Churn Agent reads conversations for signs of frustration or churn risk. Your team can then act early, before that account answers your next survey.
Calculate Your Score or Fix the Detractor Column
If you need the number alone, run the formula on your last survey and log it with the response count. Judge each quarter's move against the margin of error before you report it. Track your support KPIs beside it, too.
If the score stalls, start with the tickets behind your detractors. Look for repeat contacts, slow first answers, wrong answers and dead-end bots. Reduce those tickets first, then compare next quarter's detractor share.
Frequently asked questions
Subtract the detractor percentage (0 to 6) from the promoter percentage (9 or 10). With 96 promoters and 46 detractors out of 200 responses, NPS is 48 minus 23, or 25.
Use =(COUNTIF(B2:B201,">=9")-COUNTIF(B2:B201,"<=6"))/COUNT(B2:B201)*100 with one score per row. Adjust the range to match your data.
Yes. NPS turns negative when detractors outnumber promoters, and it can fall as low as minus 100.
Retently's benchmark, published in April 2026, puts the B2B Software and SaaS average at 41. B2B industry averages in the same report, drawn from at least 10,000 surveys, range from 41 to 68.
CSAT scores one interaction, as the share of 4 and 5 ratings on a 1 to 5 scale. NPS scores the whole relationship, as promoters minus detractors on a 0 to 10 scale.
Qualtrics, citing Bain, calls any NPS above 0 good and above 50 excellent. CSAT has no matching bands, so compare your share of 4 and 5 ratings against your own past quarters.
Passives count in the total number of responses, but the formula leaves them out of the subtraction. A large passive group pulls the score toward zero.
Survey each B2B account on a fixed schedule, such as quarterly, so you compare like with like. Send CSAT after closed tickets, and keep the two surveys in separate weeks for the same contact.
About the author

Bildad Oyugi
Head of Content
Bildad is a digital marketing expert with over 5 years of experience in copywriting, content marketing, and editing. Outside of work, he enjoys videography and spending time with his family.
Keep reading

What Is an AI Chatbot? Rule-Based vs. AI Chatbots Explained
Bildad Oyugi · 11 min read
What Is a Customer Service Center? Types, Tools and How to Set One Up
Jared Scheel · 14 min read